Cardano (ADA/USDT) Eyes Bullish Recovery Amid Market Conditions
Estimated Reading Time: 3 minutes
Don’t invest unless you’re prepared to lose all the money you invest. This is a high-risk investment and you are unlikely to be protected if something goes wrong. Take 2 minutes to learn more
Cardano Long-term Analysis: Bullish
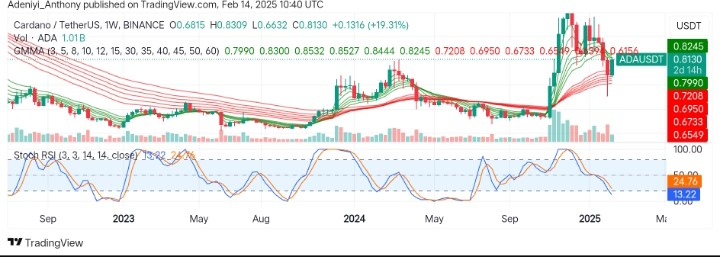
The market for Cardano against the Tether appears to be in a corrective phase following a recent movement to the south. This can be seen in the prolonged drop in the pair’s price, breaking below every support level till $0.6950 became a strong support.
Recently, the price has been making its way to the north despite the condition of the Guppy Multiple Moving Averages (GMMAs) and Stochastic RSI. These may serve as an early sign of recovering, as the trading volume increases. Therefore, this raises issues regarding sustaining the current momentum as the price eyes the $1.000 resistance level.
Currently, Cardano is trading at $0.8130 with over 1 billion traded volumes, recording 19.31% weekly gains.
Technical Indicators
Major Resistance Levels: $0.8309, $0.9200, and $1.000
Major Support Levels: $0.7208, $0.6950, and $0.6549
Cardano Technical Analysis
Based on the Cardano against the Tether weekly chart, the market seems to be making a corrective move after extended sell-offs. However, the sets of EMAs of the GMMAs show signs of convergence, as the short-period EMAs move closer to the long-period EMAs, signaling a reduced bullish momentum.
On the other hand, the Stochastic RSI suggests bearish pressure may be waning as the lines read less than 30. This signals the prices might move closer to the north in the coming weeks.
To this end, as the pair attempts recovery, a break above $0.8309 would guarantee a move toward $1000; otherwise, bearish traders may resume pushing the price further south.
ADA/USDT Analysis: Expectations
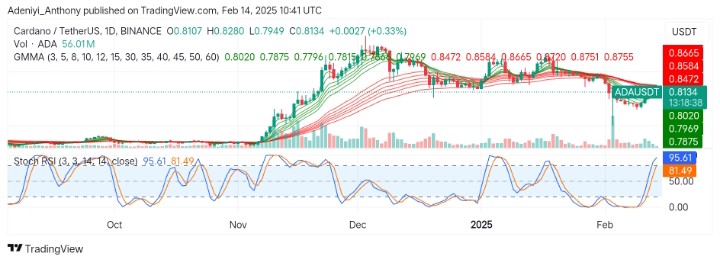
During the daily timeframe, ADA/USDT moves upward, showing bullish pressure in the market. However, the GMMAs signal a bullish crossover, as the short-period EMAs prepare to cut the long-period EMAs from below. This suggests a potential bullish continuation provided current momentum can be sustained.
On the other hand, the oscillator beneath the chart indicates an overbought signal for the pair, suggesting the price may be due for a short-term pullback before the continuation of the upside movement.
To this end, an increase in market volume, with ADA holds above $0.8020 after a slight retracement, a bullish continuation would be confirmed; otherwise, it may break below the $0.7969 support level.
You can purchase crypto coins here. Buy LBlock