Zksync (ZK/USDT) Struggles for Momentum as Bulls Eye Critical Reversal Zone
Estimated Reading Time: 3 minutes
Don’t invest unless you’re prepared to lose all the money you invest. This is a high-risk investment and you are unlikely to be protected if something goes wrong. Take 2 minutes to learn more

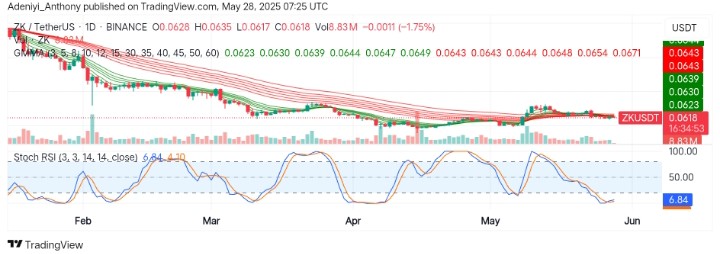
Zksync against the Tether is showing early signs of exhaustion amid prolonged consolidation. However, the pair has been in a steady downtrend since February, with some flat surfaces and reduced selling pressure, hinting at a potential accumulation phase.
Recently, the pair has been trading below the cluster of Exponential Moving Averages (EMAs) with a decreased trading volume of about 1.75%. However, the current candle suggests the bulls may need more volume to ignite a breakout as the bears tighten their grip.
Currently, Zksync trades at $0.0618, recording over 8 million traded volumes for the day.
Technical Indicators
Major Resistance Levels: $0.0630, $0.0650, and $0.0700
Major Support Levels: $0.0600, $0.0580, and $0.0500
ZkSync Technical Analysis
The daily analysis of Zksync against the Tether shows that the pair is ranging while buyers await a nice entry point. From one side, the Guppy Multiple Moving Averages (GMMAs) indicate ongoing compression after weeks of tightening movement, suggesting a directional break is increasingly possible.
On the other hand, the Stochastic RSI suggests the possibility of a move towards the north as the lines display a bullish crossover in the oversold region. This move indicates selling pressure is losing strength, and a short-term upside move could be triggered if the bulls enter the market aggressively.
To this end, a break above $0.0630 with increasing volume could spark a move beyond $0.0700. However, if the market structure remains the same, a move below $0.0600 may invalidate every bullish attempt.
ZK/USDT Analysis: What’s Next?
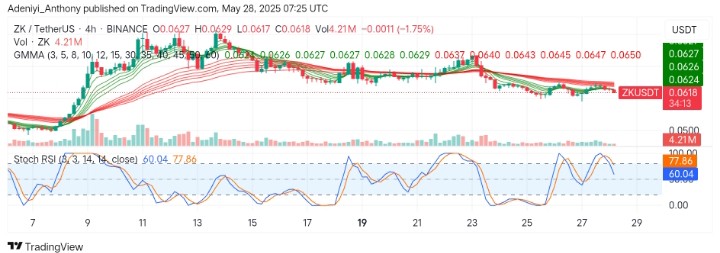
On the 4h chart, ZK/USDT appears trapped under the GMMAs, with the short-period EMAs acting as the dynamic upper limits. The price failed at $0.0640, dangling towards the south, indicating weakening bullish pressure.
Also, the Stochastic oscillator seems to be dropping from the overbought region with the blue line leading the way, showing a short-term pullback as bearish participation increases.
To this end, the $0.0630 becomes a point to watch out for, as any movement below this level would indicate a further downtrend for the pair.
You can purchase crypto coins here. Buy LBlock