Wall Street Memes (WSM) Price Touches $0.00035; Gains Stay
Estimated Reading Time: 3 minutes
Don’t invest unless you’re prepared to lose all the money you invest. This is a high-risk investment and you are unlikely to be protected if something goes wrong. Take 2 minutes to learn more

Wall Street Memes Price Prediction – December 1
A favorable crypto market backdrop—marked by improving risk appetite, steady liquidity flows, and stronger participation from retail traders—has supported Wall Street Memes (WSM). This constructive environment helped the token extend its upward momentum, allowing its price to reach and hold the $0.00035 level.
Broader market stability has encouraged traders to rotate back into speculative altcoins, giving WSM/USD market room to sustain its recent advance. As confidence strengthens, incremental buy pressure and consistent trading activity are reinforcing the token’s ability to maintain its $0.00035 zone while positioning it for potentially deeper upside continuation.
WSM/USD Market
Key Levels
Resistance levels: $0.0004, $0.00045, $0.0005
Support levels: $0.00025, $0.0002, $0.00015
WSM/USD – 4-hour Chart
The WSM/USD medium-term chart shows the broader crypto market pushing to the $0.00035 level, with existing gains holding steady.
The Stochastic Oscillators are undergoing a mild reset within a generally bearish setup. Meanwhile, the Bollinger Bands are showing a sequence of modest expansions near the upper boundary, signaling that buying pressure is gradually accumulating and creating supportive upward catalysts.
Can the WSM/USD Market Sustain Momentum as It Hits $0.00035 After Recent Gains?
The WSM/USD market can maintain momentum if buying interest stays consistent and broader sentiment remains supportive. However, sustaining levels above $0.00035 will depend on continued volume strength and the market’s ability to avoid sharp profit-taking or volatility spikes.
Additionally, the structure of recent candles suggests buyers still have a slight advantage, provided intraday pullbacks remain orderly and key short-term support zones hold firm. If trading activity continues to cluster above the $0.00035 threshold with tightening spreads, it could strengthen the likelihood of a stable consolidation phase that sets the groundwork for further upside attempts.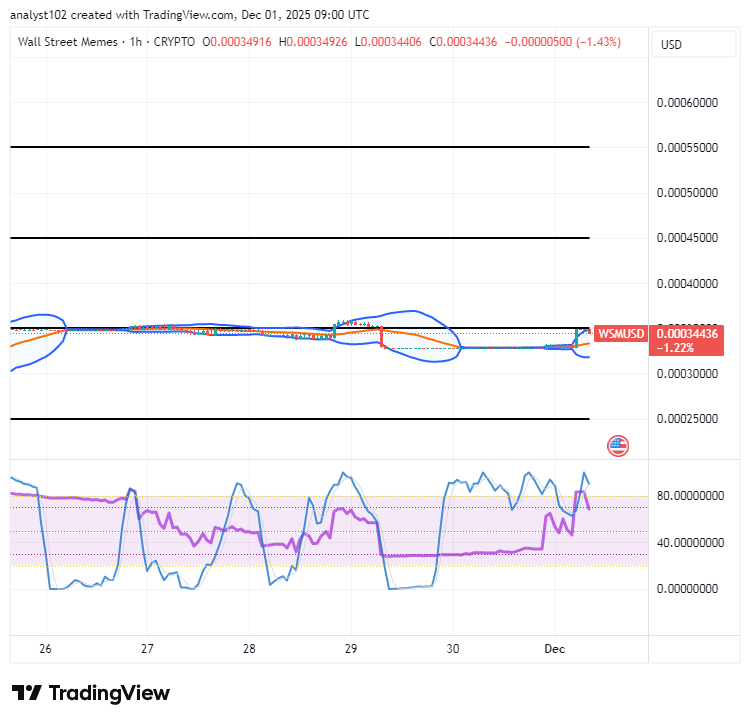
WSM/USD 1-hour chart
The WSM/USD short-term chart shows the crypto-trade touches $0.00035; the gain stays.
The Stochastic Oscillators are in the overbought region, swinging freely within it as upward momentum persists. The Bollinger Bands remain steady around the $0.00035 area, suggesting firm support and relatively muted intraday volatility amid sustained market stability.
New market pairs have been added, offering expanded exposure for those following these assets. BIGTIME and WSM are now available within Bybit’s futures ecosystem, and users of the platform’s automated tools can now monitor and manage these contracts more efficiently.
BIGTIME: https://i.bybit.com/20rabgrK
WSM: https://i.bybit.com/ab1F9gWH
#CryptoTrading #Bybit
🚀 BIGTIMEUSDT & WSMUSDT Contracts now on Bybit!
— Bybit (@Bybit_Official) October 12, 2023
Dive into new trading opportunities with 1-25x leverage. Plus, they’re now on Bybit Futures Grid Bot! Start trading now.
📈 BIGTIME: https://t.co/FAQlbhnzAh
📈 WSM: https://t.co/pb2y2AfMBE#CryptoTrading #Bybit