Tamadoge (TAMA/USD): Teeters on the Brink: Bullish Ambitions Challenged
Estimated Reading Time: 2 minutes
Don’t invest unless you’re prepared to lose all the money you invest. This is a high-risk investment and you are unlikely to be protected if something goes wrong. Take 2 minutes to learn more

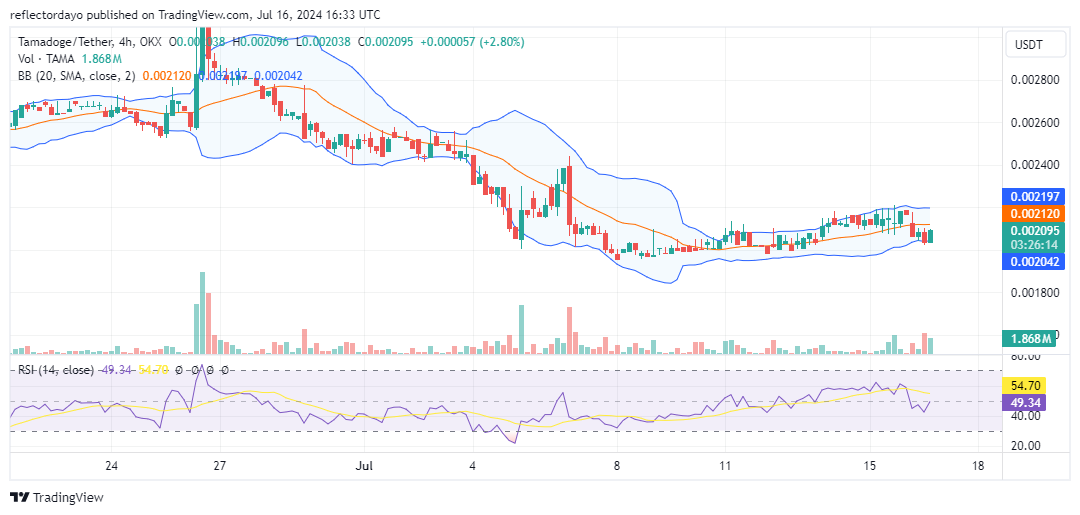
The TAMA/USD market is currently confined within a tight trading range, hovering just above the critical $0.002 support level. Recently, the price action showed an ambitious attempt to break above the $0.0022 price level. However, sellers gained significant strength after the price reached $0.0022, resulting in a downward thrust that caused the price to dip again. Despite this crypto signal, bullish sentiment remains strong at the $0.002 support level, as buyers have significantly rejected further downward movement.
Key Levels
- Resistance: $0.013, $0.014, and $0.015
- Support: $0.0025, $0.0024, and $0.0023
TAMA/USD Price Analysis: The Indicators’ Point of View
The Bollinger Bands had previously indicated an upward-trending price channel. However, after the bull market faced resistance at the $0.0022 price level, bulls demonstrated their tenacity by establishing a higher support level at $0.002042. If bullish traders can sustain such marginal price shifts, they may facilitate an eventual breakout above the key resistance level.
Considering the trading volume indicator, there are signs that the ongoing price rally might be sustainable. The significant histogram representing the current session indicates strong buying interest, which could propel the price back to the critical $0.0022 level.
Tamadoge Short-Term Outlook: 1-Hour Chart
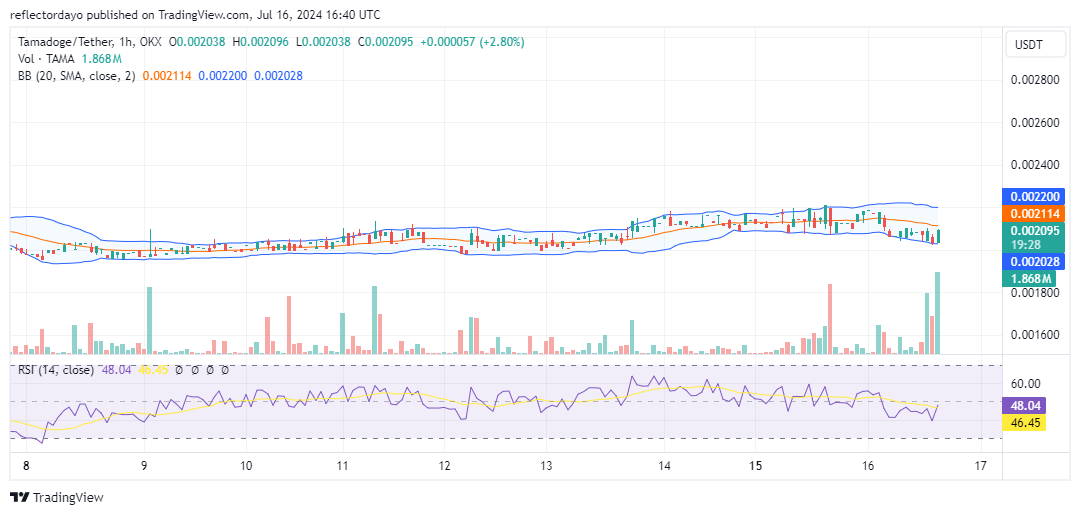
Conversely, in the 1-hour chart, there is a strong trading volume histogram represented in the latest session. However, the very bullish Marubozu candlestick reflecting the session’s trading activity does not quite align with the significant histogram. This discrepancy implies that traders may be hesitant, possibly pulling back from either buying or selling.
Stock up on Tamaverse credits to dive into exciting games like Pursuit and Arcade!
Load up with credits in the Tamaverse! 🐶
Use your credits to enter thrilling games like Pursuit and Arcade! 🎮
Compete fiercely to climb the leaderboards, showcase your skills and earn $TAMA🏆
📱 Android: https://t.co/D4TjX7gTFl
📱 iOS: https://t.co/0fjJapf5oA pic.twitter.com/vQByohbGXX— TAMADOGE (@Tamadogecoin) July 16, 2024