Polygon (MATIC/USD) Price Is Likely to Make a Pit Stop Soon
Estimated Reading Time: 3 minutes
Don’t invest unless you’re prepared to lose all the money you invest. This is a high-risk investment and you are unlikely to be protected if something goes wrong. Take 2 minutes to learn more
Polygon Price Prediction – May 28
Trading activities have surfaced between the MATIC/USD market buyers and sellers to the downside of around the $0.080 support line. In pursuance of a rise, trying to end a further fearful decline, the price has moved up vastly to exhaust the forces to warrant the current outlook as the price trades between $0.0934 and $0.0918, maintaining a positive percentage rate of 0.98. The trade verdict is that buyers tend to be having a tough time session to push reliably through the resistances over ahead from $1 in the long run.
MATIC/USD Market
Key Levels
Resistance levels: $1,05, $1.15, $1.25
Support levels: $0.80, $0.70, $0.60
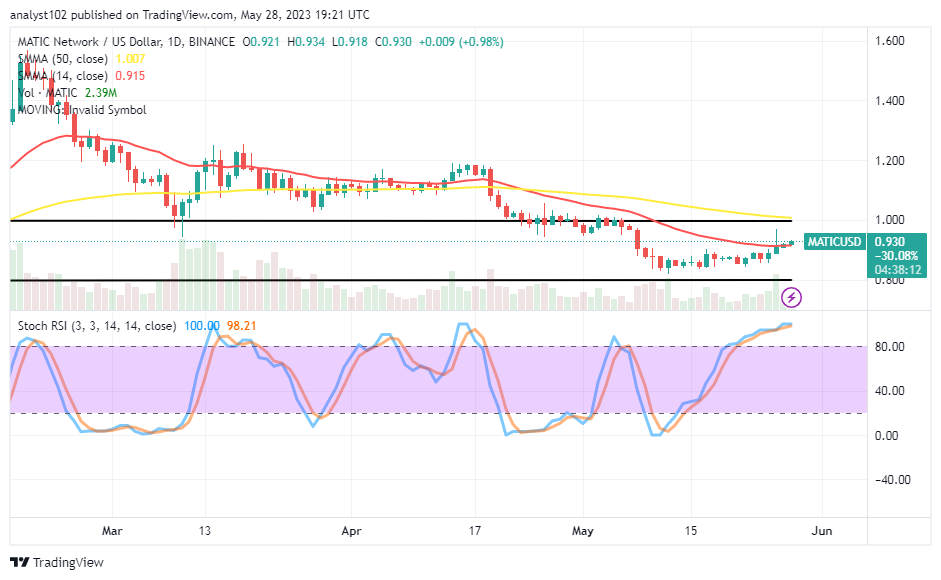
MATIC/USD – Daily Chart
The MATIC/USD daily chart t has revealed the crypto-economic price is likely to make a pit stop soon around the trend path of the smaller indicator. The 14-day SMA trend line is at $0.0915, underneath the $1.07 point of the 50-day SMA trend line. A set of the present trading candlesticks shows that pushes to the upside are moving slowly. The Stochastic Oscillators are in the overbought region, keeping 98.21 and 100. That suggests bulls are heading toward losing the stances.
What should the MATIC/USD traders’ reactions be in light of the SMAs’ current positions?
It has indicated that an overbought condition has been spotted in the MATIC/USD market operations to decimate the greater chance of having formidable increases away from the resistance values posted by the SMAs in the subsequent sessions. Price may shift points backward to re-establish support near the $0.080 support line. However, past investment positions placed above the SMAs should be allowed to run.
On the reduction-moving mode of the MATIC/USD trade, sellers may cultivate the trade idea of finding shorting positions orders around the 14-day SMA’s value, beneath the $1 resistance line. A scared bullish body candlestick forming across the SMA trend lines can produce more up-rises to a delay resuming a negative trend.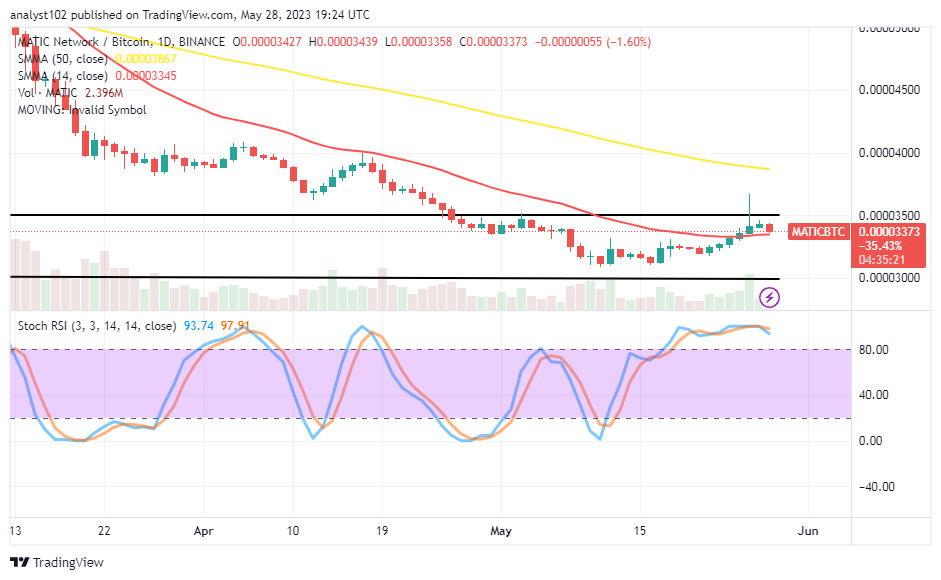
MATIC/BTC Price Analysis
In contrast, Polygon is likely to make a pit stop at a lower-trading spot around the smaller SMA against Bitcoin. The 14-day SMA indicator is below the 50-day SMA indicator. And they are still bending relatively to the downside. In the overbought region, the Stochastic Oscillators are to cross southerly at 97.91 to 9374. That implies that the counter crypto instrument will potentially be pushing against its base counterpart shortly. If that presumption turns out to be genuine, the following trade days will experience a sequence of drops.
Note: Cryptosignals.org is not a financial advisor. Do your research before investing your funds in any financial asset or presented product or event. We are not responsible for your investing results.
You can purchase Lucky Block here. Buy LBLOCK