Lucky Block Price Prediction: LBLOCK/USD Turns Lower; More Buyers May Surface
Estimated Reading Time: 3 minutes
Don’t invest unless you’re prepared to lose all the money you invest. This is a high-risk investment and you are unlikely to be protected if something goes wrong. Take 2 minutes to learn more

Free Crypto Signals Channel
The Lucky Block price prediction may continue to form higher as the bears may lose grip over the coin soon.
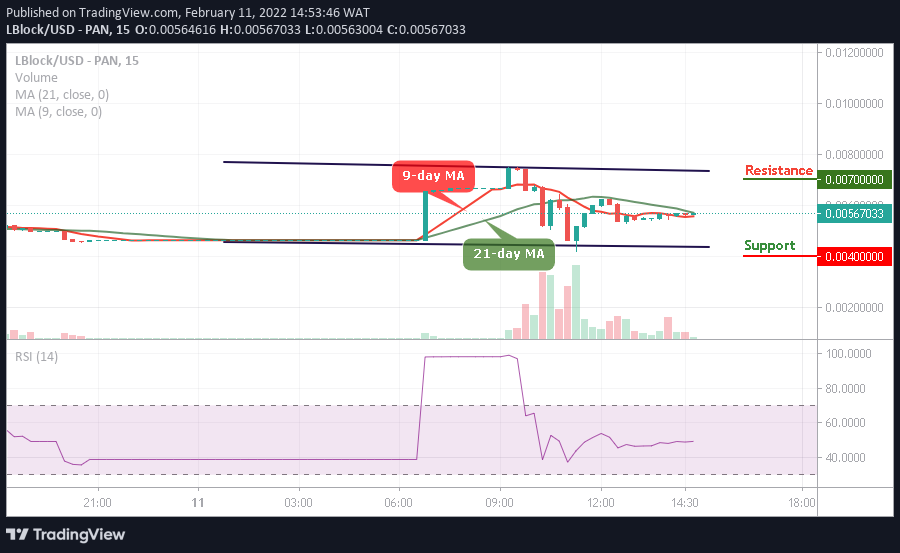
LBLOCK/USD Market
Key Levels:
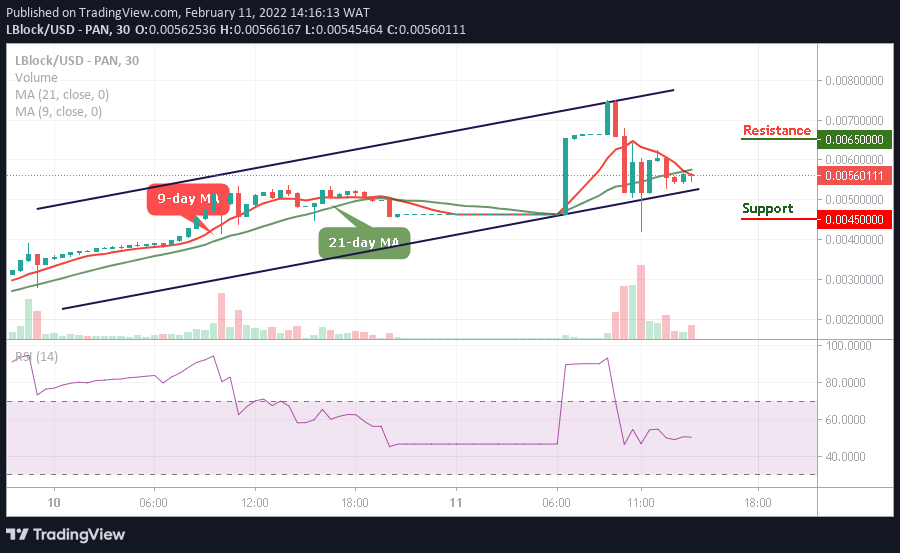
Resistance levels: $0.00650, $0.00700, $0.00750
Support levels: $0.00450, $0.00400, $0.00350
At the time of writing, LBLOCK/USD is ranging as the market price prepares to cross above the 9-day moving average. Meanwhile, the bullish momentum is propelling the coin above the resistance level of $0.00230 as the bullish pressure could break up the $0.00240 level. However, should the bulls fail to push the price upward, the Lucky block price may consolidate for a while.
Lucky Block Price Prediction: Would LBLOCK/USD Move Higher?
The Lucky Block price may continue to rise and break above the 9-day and 21-day moving averages if the bulls defend the $0.00565 support level. Therefore, any further bullish movement towards the channel may push the price to the potential resistance levels of $0.00650, $0.00700, and $0.00750.
Nevertheless, this technical analysis may be invalidated if the bears break below the lower boundary of the channel and fall to the low of $0.00450, $0.00400, and $0.00350 support levels. Moreover, the technical indicator Relative Strength Index (14) is moving around 50-level to give more bullish movements in the next positive directions.
LBLOCK/USD Medium-term Trend: Ranging (15 Minutes Chart)
Against Bitcoin, the Lucky Block price is ready to move up higher as it is ready to cross above the 21-day moving average and within a major resistance area at $0.00650. The long-term moving averages may keep the bullish movement as the market is starting a new trend.
However, if the buyers push the price and move towards the upper boundary of the channel, higher resistance could be reached at $0.00700 and above as the technical indicator Relative Strength Index (14) is moving to cross above 50-level, indicating that more bullish signals are coming to play. Moreover, should the bulls fail to move the current market value above, the bears may step back into the market and the nearest support level could be located at $0.00400 and below.
Read more: