Bitcoin Price Prediction: BTC/USDT Market Recovers From Bearish Pressure
Estimated Reading Time: 3 minutes
Don’t invest unless you’re prepared to lose all the money you invest. This is a high-risk investment and you are unlikely to be protected if something goes wrong. Take 2 minutes to learn more

Bitcoin Price Prediction (January 15):
The Bitcoin market has seen an impressive recovery from its recent price slump. The price of the leading cryptocurrency has rebounded from the $90,000 mark and is now trading just below the $97,000 mark. Trading indicators remain biased in favor of further price increases.
BTC/USDT Long-Term Trend: Bullish (Daily Chart)
Key Price Levels:
Resistance: $98,000, $100,000, $102,000
Support: $96,000, $94,000, $92,000
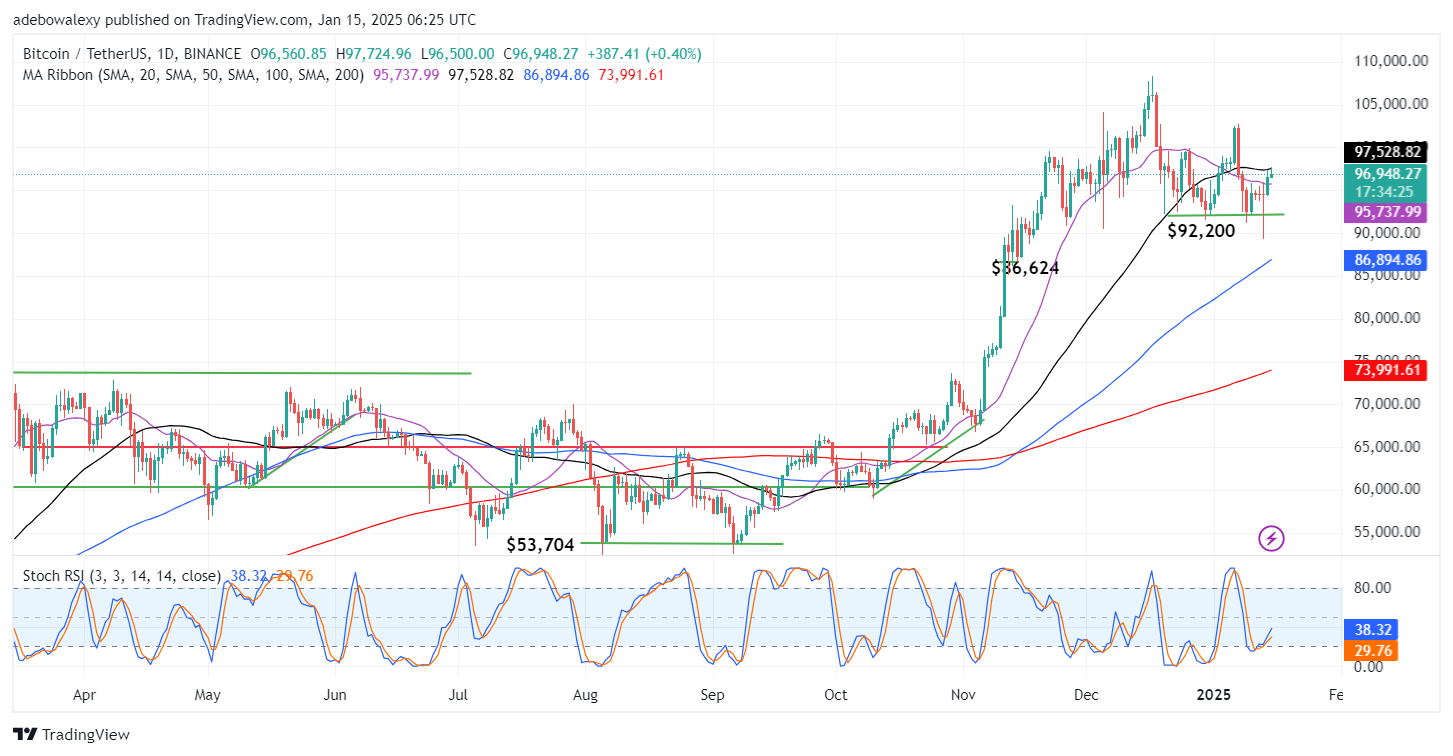
The previous and ongoing sessions are represented by green price candles on the Bitcoin daily chart. However, the latest price candle is smaller than the previous one. Additionally, the market remains below the 50-day moving average (MA) line on the chart. At the same time, the Stochastic Relative Strength Index (RSI) lines are trending upward, with the lead line nearing the 40 mark on the indicator.
Bitcoin Price Prediction: Bulls in the BTC/USDT Market Face Resistance at $97,500
The ongoing session indicates that buying activity continues to influence the Bitcoin market. However, downward forces are also limiting upward movements, as evidenced by the upper shadow on the latest price candle.
Meanwhile, the Stochastic RSI lines suggest that the short-term trend may remain bullish. This is supported by the green candle on the chart, despite the downward pressure. If the price surpasses the 50-day MA line, further increases are likely in this market.
Bitcoin Price Prediction: BTC/USDT Bears Restrict Upward Progress (4-Hour Chart)
The Bitcoin 4-hour chart reveals that bearish forces are currently dominant. The latest price candle is red, having been rejected at the 200-day MA line and the $97,000 resistance level. However, price activity remains above most of the MA lines on the chart. Furthermore, the 20-day and 50-day MA lines are nearing a potential crossover below the price action.
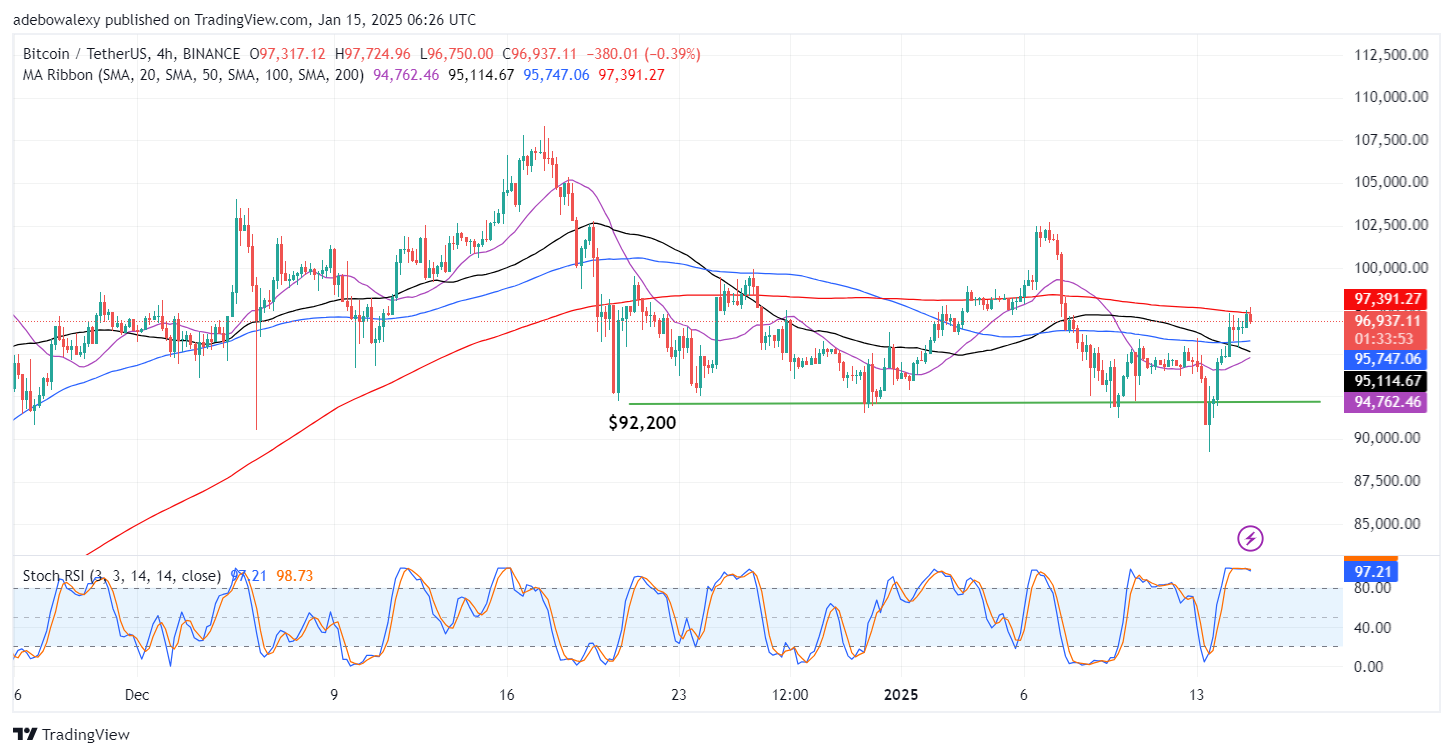
The Stochastic RSI lines are moving sideways around the 100 level of the indicator. The rejection at the $97,000 resistance suggests that this level requires stronger bullish momentum to break through. If the 20-day and 50-day MA lines converge and cross over, this could provide the momentum needed for the price to break the $97,000 resistance. A successful breakout could set the stage for a retracement to the $102,000 level.