Litecoin Price Prediction: LTC/USDT Market Stays Above the $98 Support Level
Estimated Reading Time: 3 minutes
Don’t invest unless you’re prepared to lose all the money you invest. This is a high-risk investment and you are unlikely to be protected if something goes wrong. Take 2 minutes to learn more
Litecoin Price Prediction (January 14):
Despite the significant dip in the Bitcoin market, which represents a major indicator in the crypto market, prices in Litecoin’s daily market remain above the $98 price level. This support zone appears to have become a medium-term support level in the market.
LTC/USDT Long-Term Trend: Bearish (Daily Chart)
Key Price Levels:
Resistance: $100, $110, $120
Support: $90, $80, $70
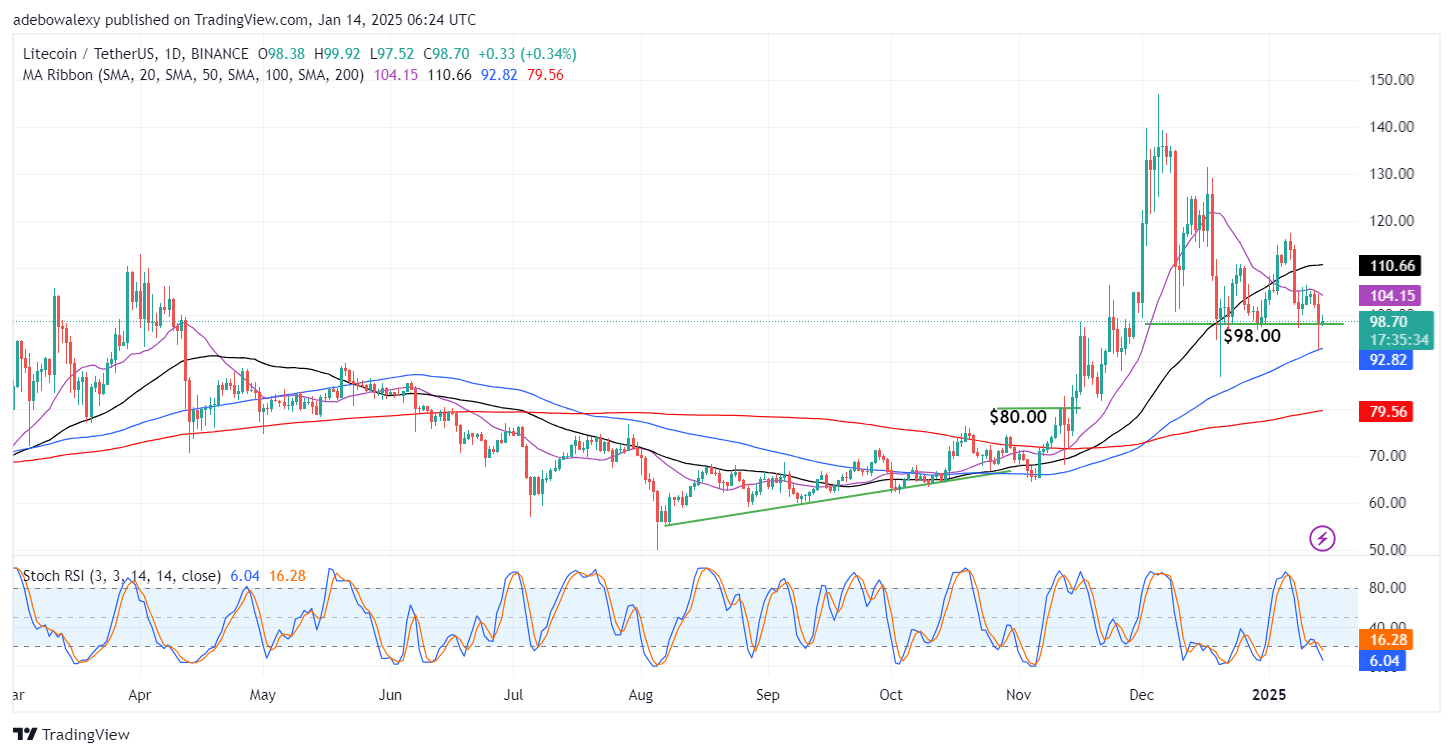
The last price candle on the chart is green as of the time of writing. Although it has contracted downward considerably, it remains above the aforementioned support level. Additionally, the price candle is below the $100 price level. The 20-day and 50-day Moving Average (MA) lines are positioned above the recently appearing price candles. At the same time, the Stochastic Relative Strength Index (RSI) lines are still falling into the oversold region of the indicator.
Litecoin Price Prediction: The $100 Mark Poses a Strong Barrier in the LTC/USDT Market
The last price candle on the Litecoin daily chart is green but appears quite small. Moreover, it has formed below a psychological price level that acts as resistance. Technically, this suggests that market forces are weighing heavily on a potential break above the $100 mark.
Meanwhile, market indicators are not favorably biased at the moment. Consequently, this puts significant pressure on buyers in the session. This pressure is resulting in a bearish contraction, as seen in the last price candle on the chart. Likewise, the downward trajectory of the Stochastic RSI indicator lines suggests that the market may succumb to bearish pressure shortly.
Litecoin Price Prediction: LTC/USDT May Not Progress Too Far Past the $100 Mark (4-Hour Chart)
Even in the Litecoin 4-hour market, price action has rebounded off the $100 resistance level. Additionally, the market is below all the MA lines. Nevertheless, the Stochastic RSI indicator lines are still progressing upward, though the lines seem to be moving more significantly than the price action on the chart.
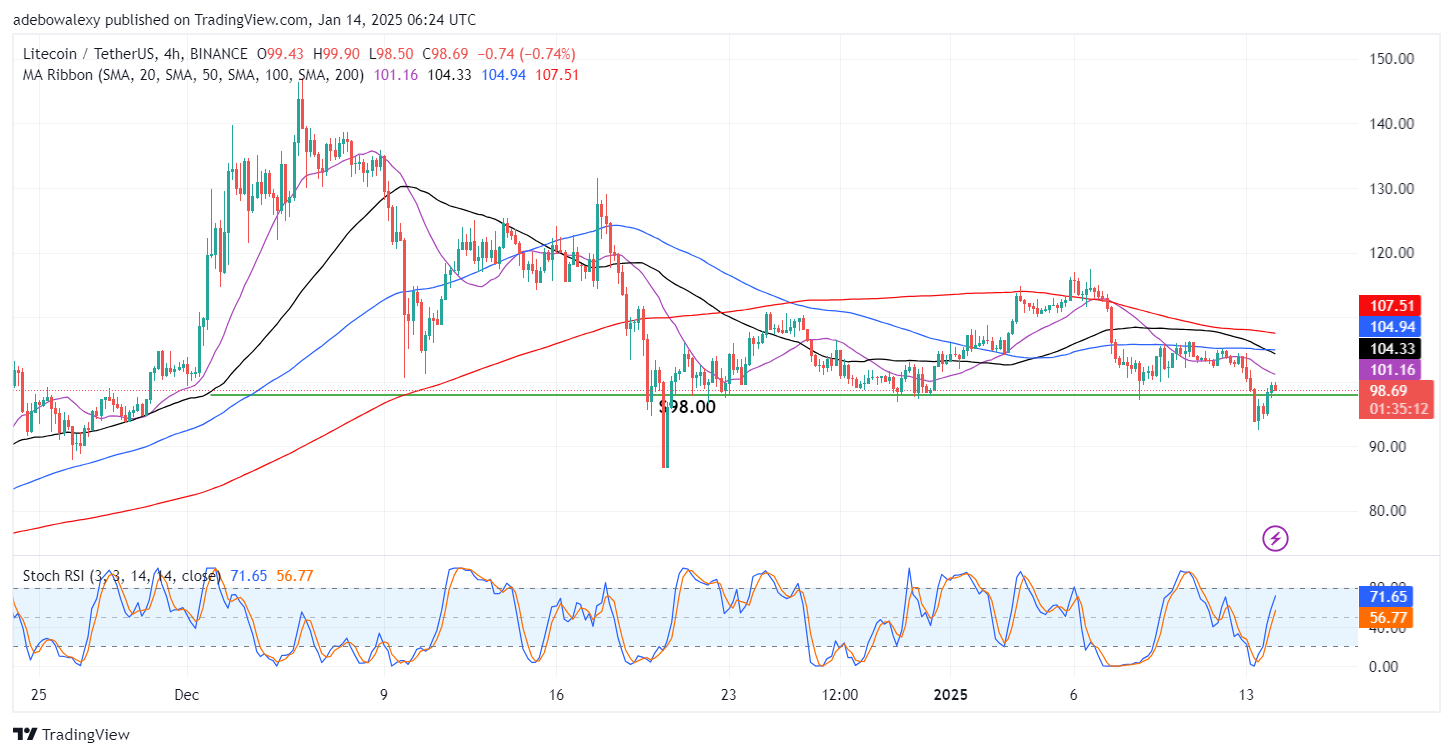
Furthermore, the 50-day and 100-day MA curves are crossing above the price action, indicating that downward forces are strengthening. Technically, indications from this market suggest that upside forces may soon be exhausted, even if price action eventually breaks through the $100 price level. Bullish traders should target the $110 price level for short-term gains.