Ripple Declines and Hovers above $1.00 Support
Estimated Reading Time: 2 minutes
Don’t invest unless you’re prepared to lose all the money you invest. This is a high-risk investment and you are unlikely to be protected if something goes wrong. Take 2 minutes to learn more
Ripple (XRP) Long-Term Analysis: Bearish
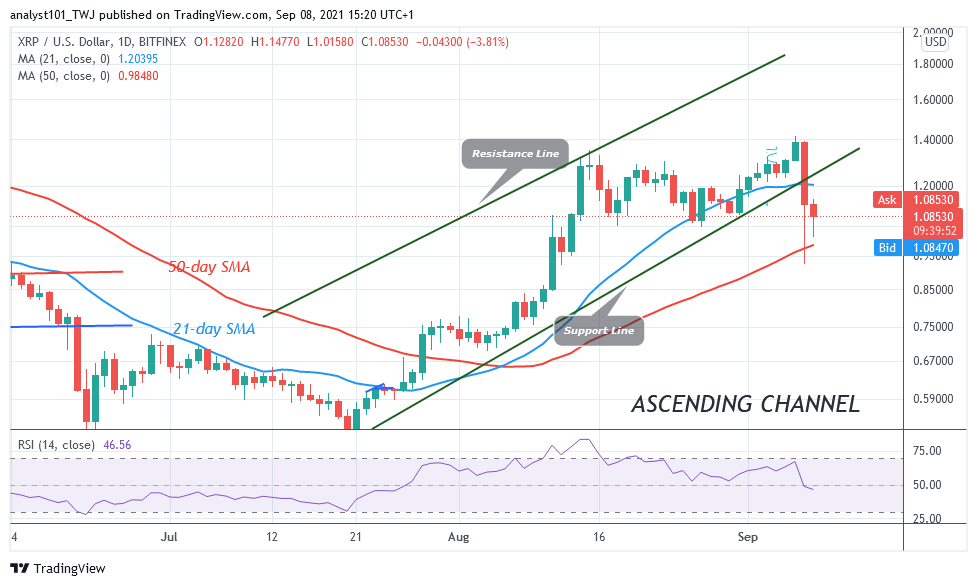
On September 7, Ripple faces rejection at the $1.40 overhead resistance. XRP dropped sharply to the low of $0.92 and pulled back. For the past 48 hours, the XRP price has been hovering above the 1.00 support. XRP price broke the 21-day SMA but found support above the 50-day SMA. The uptrend will resume if the current support holds. In the meantime, the market is consolidating above the current support at $1.00. The bearish trend has subsided above the current support.
Ripple (XRP) Indicator Analysis
Ripple has fallen to level 47 of the Relative Strength Index period 14. It indicates that XRP is in the bearish trend zone and below the centerline 50. The altcoin is above the 35% range of the daily stochastic. It indicates that it is in a bullish momentum. The 21-day and the 50-day SMA are sloping upward.
Technical indicators:
Major Resistance Levels – $2.00, $2.50, $3.00
Major Support Levels – $1.50, $1.00, $0.50
What Is the Next Direction for Ripple (XRP)
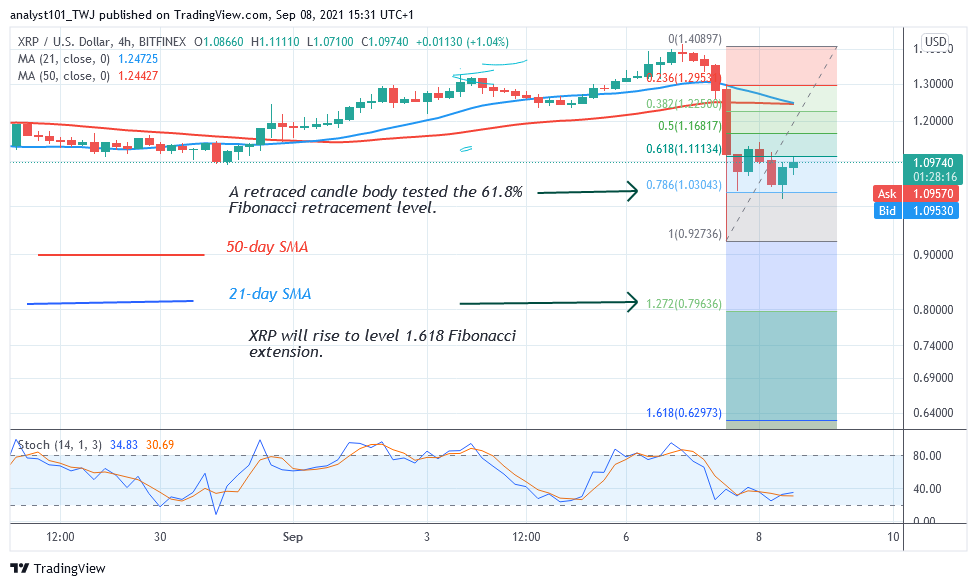
Ripple has resumed a downward move. For the past two days, XRP/USD has been fluctuating above the $1.0 support. Meanwhile, on September 7 downtrend; a retraced candle body tested the 78.6% Fibonacci retracement level. The retracement indicates that XRP will fall but reverse at level 1.272 Fibonacci extension or level $0.79.
You can purchase crypto coins here. Buy Tokens
Note: Cryptosignals.org is not a financial advisor. Do your research before investing your funds in any financial asset or presented product or event. We are not responsible for your investing results