Bitcoin Cash (BCH/USD) Trade Hits Resistance Closely Below $400
Estimated Reading Time: 3 minutes
Don’t invest unless you’re prepared to lose all the money you invest. This is a high-risk investment and you are unlikely to be protected if something goes wrong. Take 2 minutes to learn more

Free Crypto Signals Channel
Bitcoin Cash Price Prediction – March 25
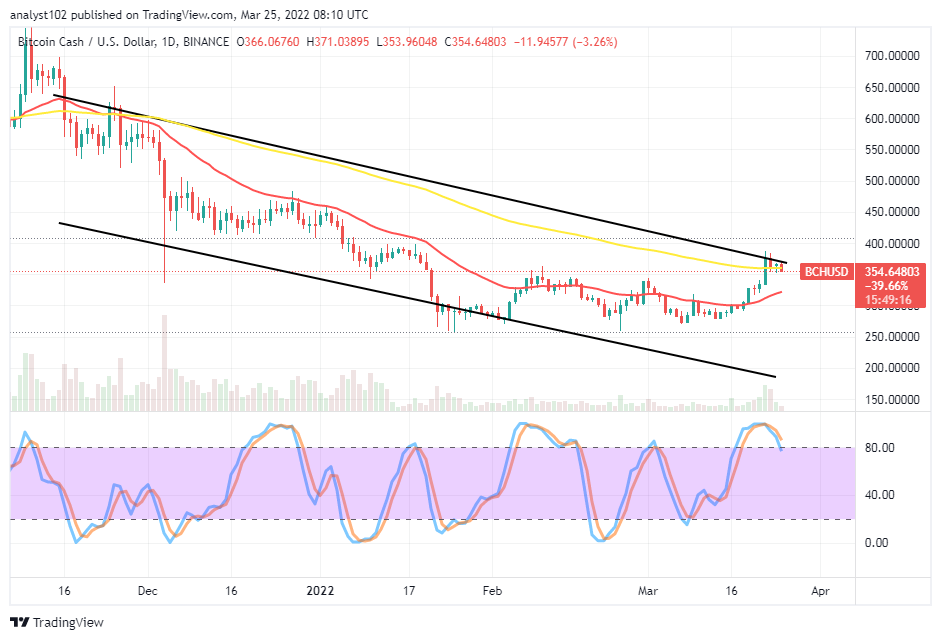
The BCH/USD market business operations have rallied higher through some resistances recently as the crypto-economic trade hits resistance closely below the $400 line. The current financial trading status of the economy produced a high of $371 and a low of $353, keeping a percentage of 3.26 negatives.
BCH/USD Market
Key Levels:
Resistance levels: $400, $450, $500
Support levels: $300, $250, $200
BCH/USD – Daily Chart
The BCH/USD daily chart showcases the crypto-economic trade hits resistances closely below $400 level as a bullish emerged against the trend line of the bigger SMA on March 22nd. The emergence of the candlestick brought about the closure trading approach that is turning to give a chance for a downward returning motion around the SMA. The 50-day SMA indicator is above the 14-day SMA indicator. The Stochastic Oscillators are in the overbought region, attempting to cross southbound against the range of 80. The crypto’s price may soon run declining against the US Dollar.
Is the current trading situation in the BCH/USD market enough to go for short orders as the crypto trade hits resistance closely below $400?
Technical analytics support shorting of positions currently in the BCH/USD market operations as the crypto-economic trade hits resistance closely below $400. Therefore, it would be good that long-position takers stay off for a while because the present trading pattern doesn’t back any forthcoming upward forces that can emanate beyond that value-line in the long-term run of the crypto economy.
On the downside of the technical analysis, the BCH/USD short-position takers may now have to be on the lookout for active reversal motion from the present convergences of price closely beneath the $400 level before launching a sell order afterward. Expectantly, some subsequent forces to the upside above the upper bearish trend line are likely to turn false in no time for the shorting traders to take advantage.
BCH/BTC Price Analysis
In comparison, Bitcoin Cash’s valuation has been seen for the first time to push higher against Bitcoin from a lower trading spot that it had been going lately. The cryptocurrency pair trade hits resistance above the trend line of the bigger SMA. There have been variant bearish candlesticks emerging downward against the 50-day SMA indicator as the 14-day SMA indicator is underneath it. The Stochastic Oscillators have crossed southbound from the overbought region against the range of 80. And they are still pointing toward the south direction to suggest the base crypto tends to downsize more against counter crypto.
Note: Cryptosignals.org is not a financial advisor. Do your research before investing your funds in any financial asset or presented product or event. We are not responsible for your investing results.
You can purchase Lucky Block here. Buy LBlock: