Tamadoge (TAMA/USD): Consolidates Near $0.002: Bullish Revival on the Horizon?
Estimated Reading Time: 3 minutes
Don’t invest unless you’re prepared to lose all the money you invest. This is a high-risk investment and you are unlikely to be protected if something goes wrong. Take 2 minutes to learn more
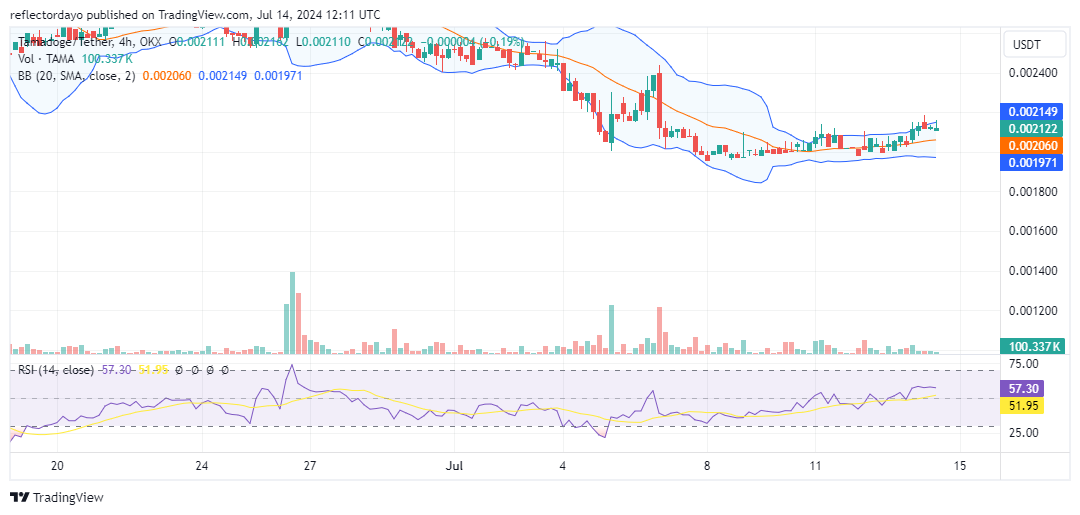
Tamadoge (TAMA) has been trading in a narrow range just above the critical $0.002 support level, indicating a potential battleground between buyers and sellers. While bears have struggled to push prices lower, bulls have yet to achieve a decisive upward breakout. However, bullish efforts are pushing through strong bearish resistance. The candlesticks’ upper shadows indicate that bearish resistance is present around the $0.00208 price level, but the market is gradually pushing towards the $0.0022 price level.
Key Levels
- Resistance: $0.013, $0.014, and $0.015
- Support: $0.0025, $0.0024, and $0.0023
TAMA/USD Price Analysis: The Indicators’ Point of View
Although the price ascent is slow and almost insignificant, it is noticeable. A close examination of the chart reveals that the price action has consistently been curtailed at the $0.002 level, with most swings occurring above this threshold. This dynamic underscores the strength of the bulls at this price level. The Tamadoge trading volume shows very small histograms, signifying low trading activity and investor interest at the moment. This crypto signal may explain the sluggish bullish price bounce. However, as indicated by the Bollinger Bands, the market is set on an upward trajectory. As soon as we see an increase in trading volume, we are likely to witness a significant upward movement in the market.
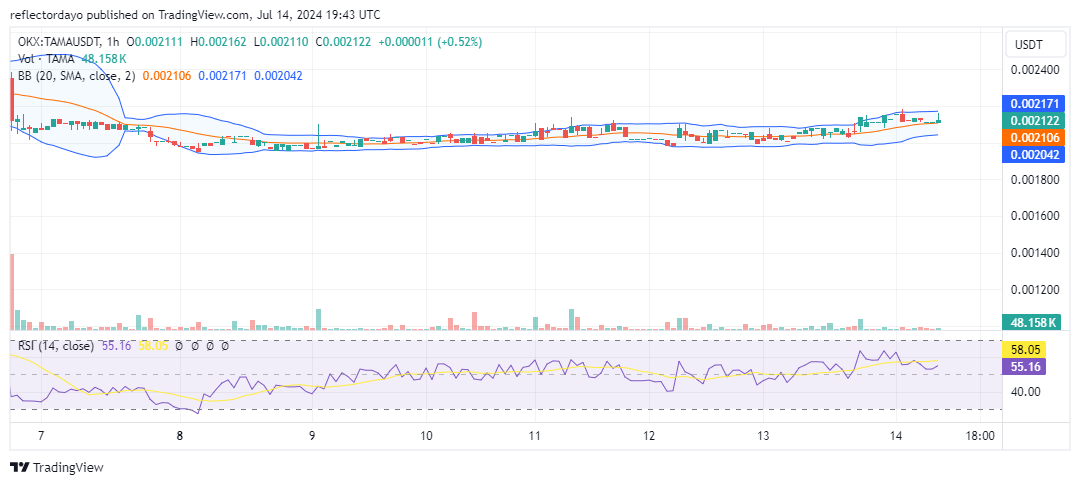
Tamadoge Short-Term Outlook: 1-Hour Chart
The potential direction of the Tamadoge market is becoming somewhat clearer. Even on the 1-hour chart, we see the market starting to take an upward trajectory, though it remains sluggish. There is still a long way to go, and the $0.0022 price level needs to be firmly established. The low trading volume on the 1-hour chart explains the sluggishness of the bullish trend. However, the trend may change in the coming week with stronger momentum, potentially causing the price to surge significantly.
Buy TAMA/USD!
Finish your weekend on a high with #Tamadoge 🐶
Play as your pet in Tamadogi, Arena & Arcade and beat the rest of the competition! 🏆
Earn $TAMA – the higher you score, the more you win! 💰
Play here 👇
📱 Android: https://t.co/D4TjX7gTFl
📱 iOS: https://t.co/0fjJapf5oA pic.twitter.com/y2AJOhNVMm— TAMADOGE (@Tamadogecoin) July 14, 2024