SPONGE/USD ($SPONGE) Sees Bullish Momentum Above $0.00011, Anticipating Higher Price Levels
Estimated Reading Time: 3 minutes
Don’t invest unless you’re prepared to lose all the money you invest. This is a high-risk investment and you are unlikely to be protected if something goes wrong. Take 2 minutes to learn more
In our previous $SPONGE analysis, we observed bullish activity coalescing around the $0.00011 level following a notable retracement from the $0.000116 peak. As anticipated in our prior analysis, the continuation of the bullish trend hinges on the establishment of a support level above $0.00011. The bullish momentum remains evident as higher lows are forming, with a new support level emerging around $0.0001123. This development is expected to sustain the upward momentum in the bull market.
Key Price Levels
- Resistance: $0.000115, $0.000120, and $0.000125.
- Support: $0.000090, $0.000080, and $0.000085.
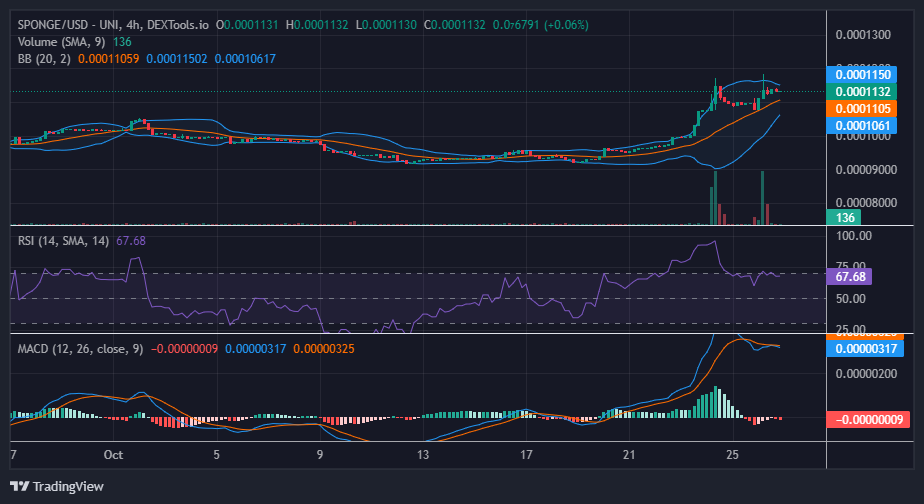
SPONGE/USD ($SPONGE) Price Analysis: Technical Insights
There appears to be a significant resistance barrier at the $0.0001150 price level, which explains why, after the bulls established a support level at $0.0001123, market activity flattened out. This stalling can be attributed to the resistance encountered at $0.0001150. The resistance is currently under pressure, and should the bulls maintain their position at the new higher support, the bullish trend is expected to persist.
The Bollinger Bands indicator is presently converging around the market action, centered at approximately the $0.0001132 price level. This convergence suggests an imminent upside breakout in the market. The indicators utilized in this analysis strongly indicate a prevailing bullish sentiment in the $SPONGE market. Although this has led the Relative Strength Index to approach the overbought threshold, the price can continue its upward trajectory if the bullish sentiment remains robust.
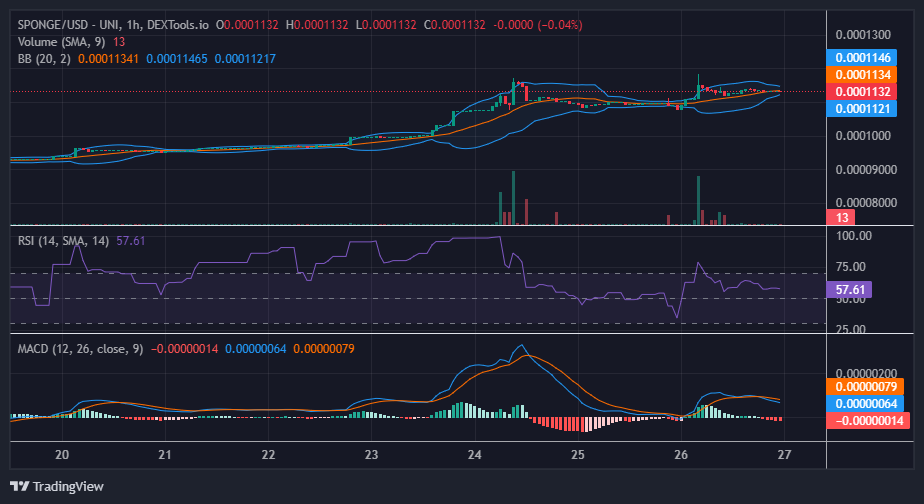
Short-Term Outlook: 1-Hour Chart
Examining the 1-hour chart, we observe a consolidation phase at the $0.0001132 price level. The current price action closely aligns with the 20-day moving average, signifying equilibrium, as indicated by the Bollinger Bands. However, the Relative Strength Index maintains steady momentum at 57.61, positioning it in bullish territory, thus presenting a bullish signal.
Soon, the $SPONGE airdrop will finish.
The $SPONGE airdrop ending soon
You know what to do 🧽🧽🧽💦💦#Web3 #Crypto #MemeCoin #Alts pic.twitter.com/styrG7onnx
— $SPONGE (@spongeoneth) October 27, 2023
Invest in the hottest and best meme coin. Buy Sponge ($SPONGE) today!