Wall Street Memes (WSM) Price Tags $0.00035; Rise Lasts
Estimated Reading Time: 3 minutes
Don’t invest unless you’re prepared to lose all the money you invest. This is a high-risk investment and you are unlikely to be protected if something goes wrong. Take 2 minutes to learn more

Wall Street Memes Price Prediction – November 29
A wave of fresh buy orders entered after WSM bounced off a key intraday support zone. Increased spot demand, paired with lighter selling pressure, pushed the token toward the $0.00035 area, allowing the upward move to hold through the session.
Buyers in the WSM/USD market operations have continued to step in on minor dips, showing steady interest around the lower trading zones. Their activity has kept upward pressure on the chart, helping the market maintain its climb despite brief pauses in momentum.
WSM/USD Market
Key Levels
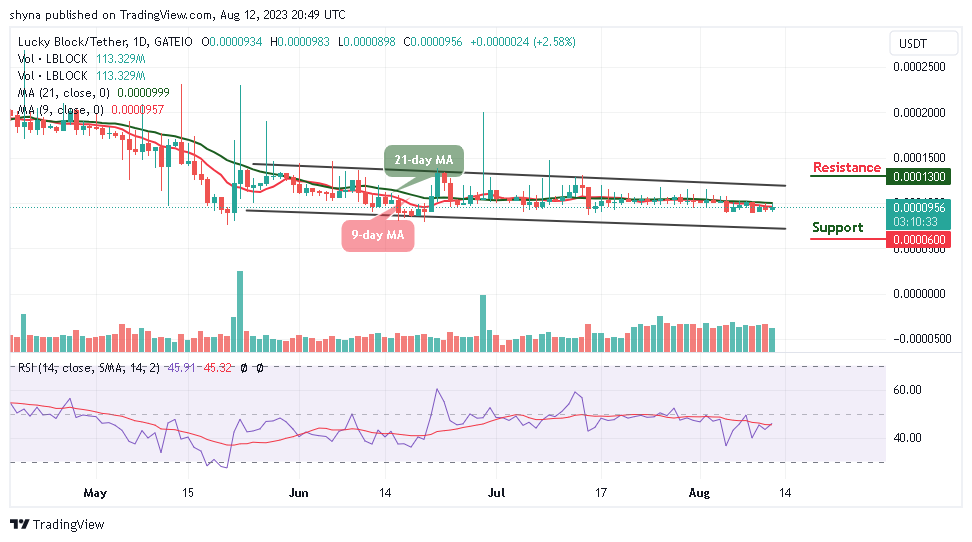
Resistance levels: $0.0004, $0.00045, $0.0005
Support levels: $0.00025, $0.0002, $0.00015
WSM/USD – 4-hour Chart
The WSM/USD medium-term chart shows the price holding near $0.00035, with the ongoing rise appearing likely to extend further.
The Stochastic Oscillators are in a free swerving mode, demonstrating that a series of recouping processes are ongoing. The Bollinger Bands indicators are currently showing a sequence of smaller bullish candlesticks pushing toward the upper band, signaling cautious upward pressure.
Does Wall Street Memes (WSM) Holding Above $0.00035 Signal Further Strength In the Ongoing Rise?
Holding above $0.00035 suggests buyers still have control, as the level acts as short-term support. If trading volume stays firm and sellers remain limited, WSM/USD trade could maintain its upward path, though momentum may fluctuate with broader market shifts.
This steady hold above the level also hints that market participants view the zone as a fair value area for continuation. As long as buyers keep defending intraday pullbacks, the broader structure may preserve its upward tilt even during brief consolidations.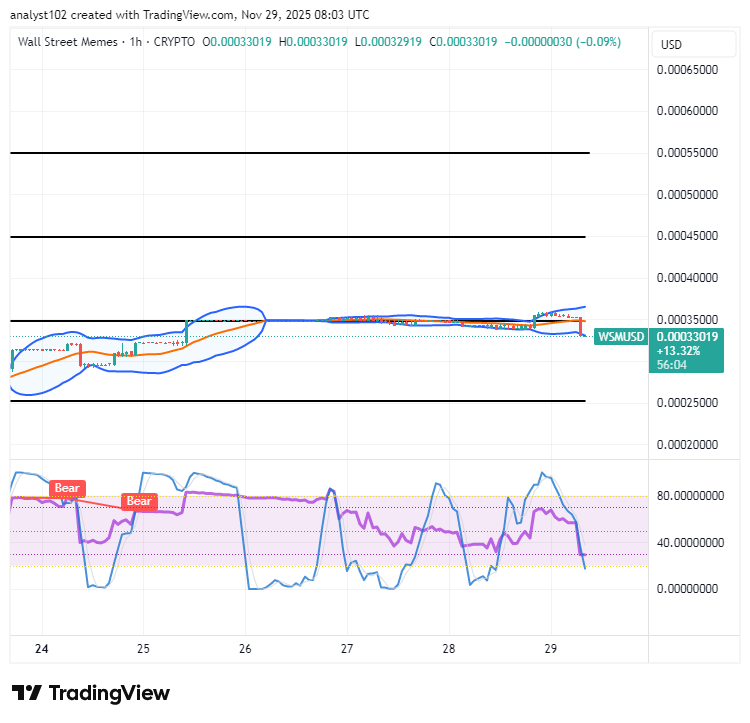
WSM/USD 1-hour chart
The WSM/USD short-term chart showcases the former crypto-trade economy tags around $0.00035; the rise in the pushing pace tends to last longer.
The Bollinger Bands remain steady around the $0.00035 area, suggesting firm support and relatively muted intraday volatility. Meanwhile, the Stochastic Oscillators sit deep in oversold territory, hinting at possible accumulation phases and the chance of a short-term rebound.
The $WSM / $USDT pair is now available for trading on Bybit Perpetuals.
You can view the market here: [https://i.bybit.com/1Wab4K3z](https://i.bybit.com/1Wab4K3z)
If you’d like to recommend a project for listing, you can submit suggestions here:
[http://i.bybit.com/1Fd2aboX](http://i.bybit.com/1Fd2aboX)**
$WSM community, we saw your Tweets! 👏$WSM / $USDT is now tradeable on #Bybit Perpetuals.
— Bybit (@Bybit_Official) October 13, 2023
Trade here: https://t.co/le4XyVyXaZ
Also want your project listed? Share your suggestions here:https://t.co/W7EWJVVNV5 https://t.co/XgXoL7g0rF