Wall Street Memes (WSM) Trade Braces Up; Upside Is Growing
Estimated Reading Time: 3 minutes
Don’t invest unless you’re prepared to lose all the money you invest. This is a high-risk investment and you are unlikely to be protected if something goes wrong. Take 2 minutes to learn more

Wall Street Memes Price Prediction – November 27
Wall Street Memes (WSM) trade braces up as upside pressure grows, with buyers slowly increasing control while short-term indicators lean northward. The improving flow near key support zones suggests steadier momentum could form, allowing the market to push gradually higher if demand holds firm.
This balanced stance signals that the WSM/USD market’s short-term hesitation may give way to steadier accumulation, allowing long-term investors to feel positioned to thrive afterward as broader momentum begins leaning toward a more durable upward path.
WSM/USD Market
Key Levels
Resistance levels: $0.0004, $0.00045, $0.0005
Support levels: $0.00025, $0.0002, $0.00015
WSM/USD – 4-hour Chart
The WSM/USD medium-term chart shows the crypto market bracing up in its current momentum, with price action gradually forming an upside bias.
The Bollinger Bands indicators are currently showing a sequence of smaller bullish candlesticks pushing toward the upper band, signaling cautious upward pressure. Meanwhile, the Stochastic Oscillators have swerved northward into the overbought region, suggesting that buyers are actively consolidating positions while preparing for a potential continuation of the upward trend.
Can WSM Sustain Its Upward Bias as Buyers and Sellers Balance Alongside the Upper Bollinger Band?
The WSM/USD market tends to sustain its upward bias as price action steadies near the upper Bollinger Band, showing controlled bullish pressure.
Buyer–seller balance remains tight, but maintained closes above mid-band support could help reinforce the trend’s strength and extend gradual upside movement.
The short-term consolidation along the upper band indicates cautious accumulation by buyers while sellers test profit-taking levels. If momentum persists, breaking minor resistance points could trigger stronger upward moves, attracting long-term investors and creating a more durable bullish trajectory. Monitoring volume and volatility will be key to confirming continued trend strength.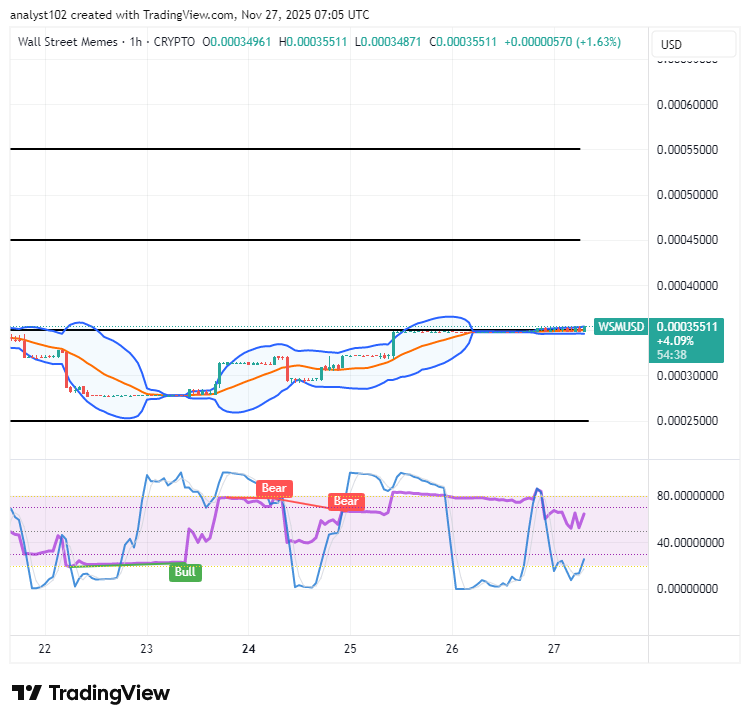
WSM/USD 1-hour chart
The WSM/USD short-term chart showcases the base crypto-economic trade steadily bracing up, as upside momentum continues to grow.
The Stochastic Oscillators are currently lingering deep in the oversold region, signaling potential accumulation zones and short-term reversal possibilities for market participants. The Bollinger Bands are holding a stable and firm stance around $0.00035 points, providing consistent support and indicating reduced volatility across intraday price swings.
BIGTIMEUSDT and WSMUSDT contracts have now been listed on Bybit, opening up fresh market-watching opportunities. These pairs also appear in the Bybit Futures Grid Bot lineup, giving users more ways to monitor price movements and strategy models.
🚀 BIGTIMEUSDT & WSMUSDT Contracts now on Bybit!
— Bybit (@Bybit_Official) October 12, 2023
Dive into new trading opportunities with 1-25x leverage. Plus, they’re now on Bybit Futures Grid Bot! Start trading now.
📈 BIGTIME: https://t.co/FAQlbhnzAh
📈 WSM: https://t.co/pb2y2AfMBE#CryptoTrading #Bybit