Ripple Is in a Decline but Challenges Resistance at $0.3840
Estimated Reading Time: 2 minutes
Don’t invest unless you’re prepared to lose all the money you invest. This is a high-risk investment and you are unlikely to be protected if something goes wrong. Take 2 minutes to learn more
Ripple (XRP) Long-Term Analysis: Bearish
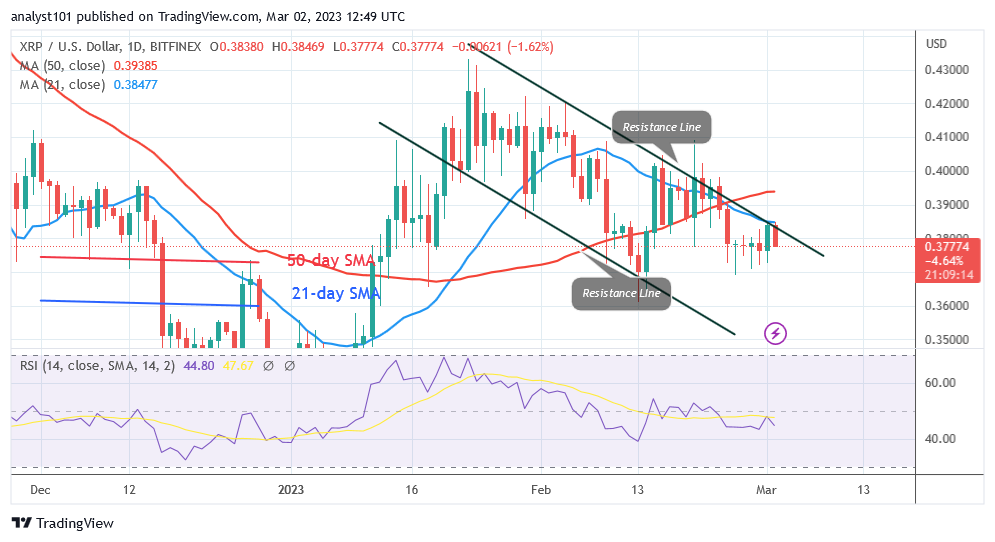
Ripple (XRP) price is falling below the moving average lines but challenges resistance at $0.3840. Since then, the price of XRP has decreased to a low of around $0.37. The price of the cryptocurrency asset has been fluctuating between $0.37200 and $0.38400. Yesterday, buyers tried to break over the $0.38 resistance, but the 21-day line SMA resisted them. Today, XRP is falling as it gets closer to the $0.37 support level. On the negative, the altcoin will continue to fall to lows of $0.34 and $0.36 if the bears break through the support at $0.37. If the price rises above the moving average lines, XRP will resume its bullish trend.
Technical indicators:
Major Resistance Levels – $2.00, $2.50, $3.00
Major Support Levels – $1.50, $1.00, $0.50
Ripple (XRP) Indicator Analysis
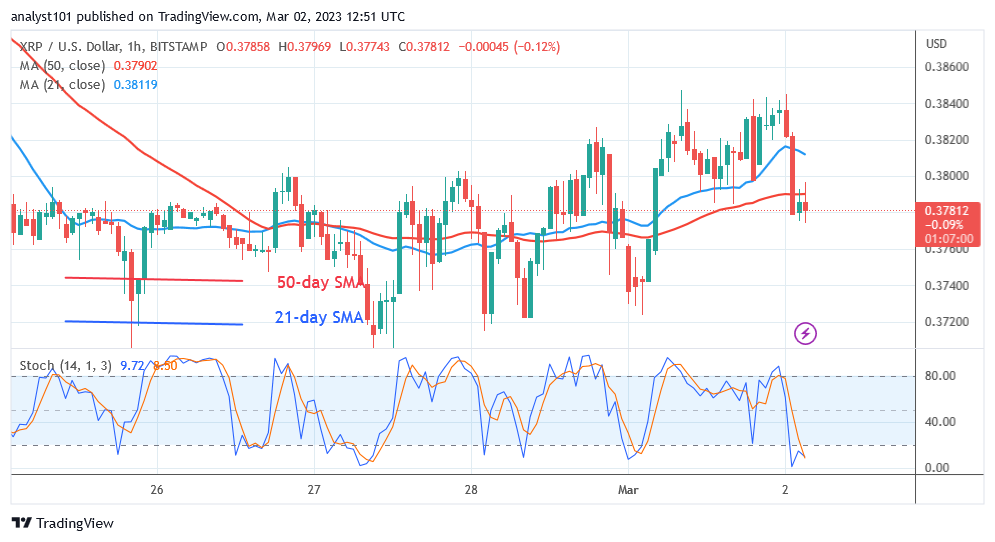
Further falls are possible given that the cryptocurrency asset’s Relative Strength Index level for period 14 is 45. But, as the price bars are below the moving average lines, XRP could decline. The daily Stochastic’s oversold region, which is below level 20, has been achieved by the current decrease. It shows that as buyers start to show up in the oversold area, the selling pressure has decreased.
What Is the Next Direction for Ripple (XRP)?
Ripple current decline reaches the point of bearish exhaustion as it challenges resistance at $0.3840. The challenge for buyers is to overcome the initial resistance at $0.3840. The cost of XRP is $0.3781 as of this writing. The first barrier at $0.3840 will be broken, which is a positive development.
You can purchase crypto coins here. Buy LBLOCK
Note: Cryptosignals.org is not a financial advisor. Do your research before investing your funds in any financial asset or presented product or event. We are not responsible for your investing results