Quant Price Prediction: QNT/USD Looks Ready For Another Leg Higher Above $115 Level
Estimated Reading Time: 3 minutes
Don’t invest unless you’re prepared to lose all the money you invest. This is a high-risk investment and you are unlikely to be protected if something goes wrong. Take 2 minutes to learn more
Quant Price Prediction – December 27
The Quant price prediction gains 5.33% as bulls keep working hard to nurture a bullish trend from the opening price of $109.38.
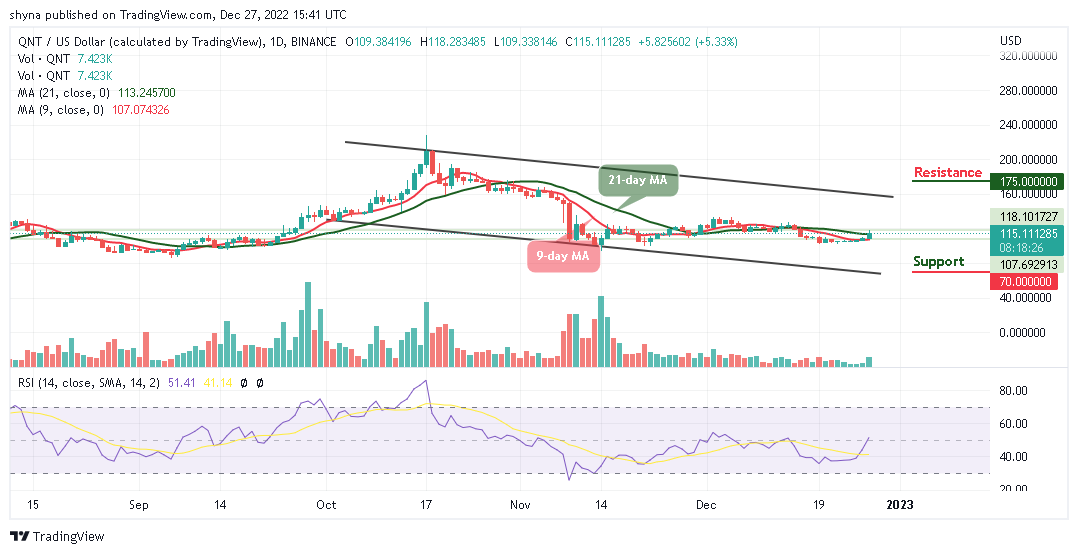
QNT/USD Long-term Trend: Ranging (Daily Chart)
Key levels:
Resistance Levels: $175, $195, $205
Support Levels: $70, $50, $30
QNT/USD is trading at the $115.1 resistance level above the 9-day and 21-day moving averages after the king coin touches the daily high at $118.28. For the past few days, the Quant price has been moving sideways, and in the context of this; an upward movement toward the resistance level of $120 is expected.
Quant Price Prediction: Will QNT Break Above the $120 Resistance Level or Reverse?
If the Quant price can continue the upward movement above the moving averages, it is likely for the market price to touch the $120 level. This is where traders should expect buyers to fight for a further rise in QNT/USD. However, the purpose of this movement is to provide a resistance level that is close to $150 as the technical indicator Relative Strength Index (14) moves to cross above the 50-level.
Looking at the daily chart, QNT/USD may experience a quick retracement or sell-off just in case it touches the crucial $120 level but if not; traders may see additional resistance levels of $175, $195, and $205 above the upper boundary of the channel. On the downside, if the market decides to fall, the Quant price could fall below the moving averages, and if that support fails to hold the sell-off, QNT/USD could see a further decline towards the support levels of $70, $50, and $30.
QNT/USD Medium-term Trend: Ranging (4H Chart)
On the 4-hour chart, traders expect the coin to gain the lost momentum and could hit the trade above $120. On the contrary, if the selling pressure exists and holds the coin not to be able to cross above the upper boundary of the channel, the $105 and below may come into play.
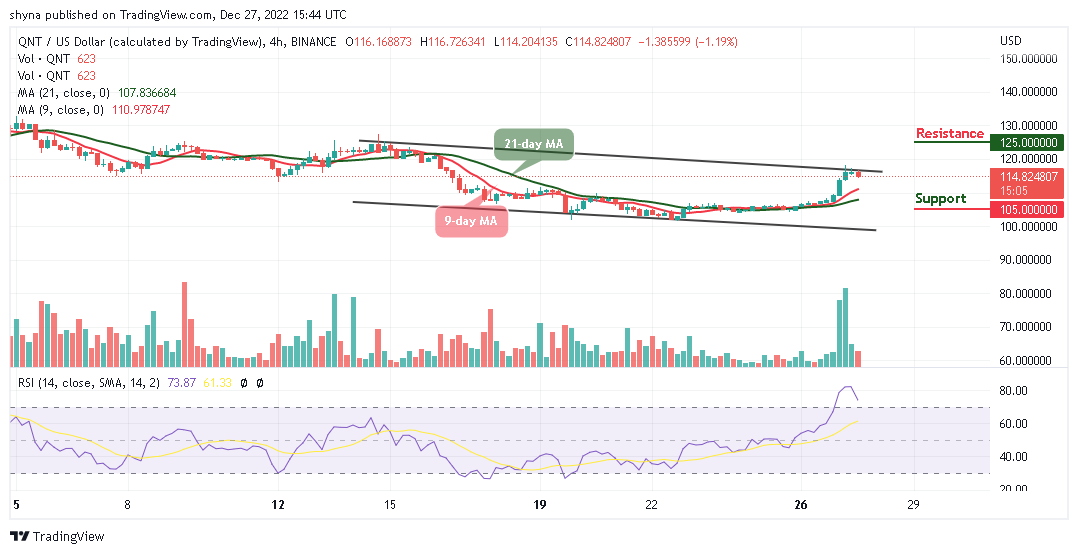
Moreover, in as much as the buyers keep the price above the 9-day and 21-day moving averages, traders may expect a strong bullish movement above the channel that could hit the resistance at $125 and above. Meanwhile, the technical indicator Relative Strength Index (14) is likely to cross below the 70-level, suggesting that a bearish signal may come into focus.
Place winning Quant trades with us. Get QNT here