Wall Street Memes (WSM) Market Jerks Up, Sellers Lose Base
Estimated Reading Time: 4 minutes
Don’t invest unless you’re prepared to lose all the money you invest. This is a high-risk investment and you are unlikely to be protected if something goes wrong. Take 2 minutes to learn more

Wall Street Memes Price Prediction – November 26
Wall Street Memes (WSM) systematically shows an upward jerk against the USD as buyers regain clear control, forcing sellers off their base. Strengthening momentum above short-term EMAs signals improving demand, while tightening ranges hint at a potential continuation move if bullish volume holds firm.
The WSM/USD market extends its upward jerk as buyers tighten control across intraday levels, pushing sellers further off their weakening base. Price action continues to firm up, showing a recovering structure. Increasing bullish volume and narrowing pullbacks suggest rising market confidence, with momentum indicators hinting that WSM could attempt a steady continuation phase if current strength persists.
WSM/USD Market
Key Levels
Resistance levels: $0.0004, $0.00045, $0.0005
Support levels: $0.00025, $0.0002, $0.00015
WSM/USD – 4-hour Chart
On the medium-term chart, the WSM/USD market has been jerking up, leading to sellers losing base formation.
The Stochastic Oscillators have continued swerving northbound, remaining firmly positioned within the medium overbought region. Multiple candlesticks are forming along the upper band of the Bollinger structure, indicating rising buying pressure and reinforcing the ongoing increase in bullish market strength.
Can WSM/USD Trade Maintain Its Upward Momentum as Sellers Lose Their Structural Base?
Wall Street Memes (WSM) may sustain its upward momentum as buyers keep pressure on retreating sellers. Firm price action, improving volume flows, and steady intraday support zones suggest the market could hold its advance, provided bullish interest continues to stabilize short-term fluctuations.
Wall Street Memes (WSM) appears positioned to pair with the USD to maintain its upward momentum as buyers continue to pressure weakened sellers across intraday levels. Strengthening price behavior, improving volume flows, and consistent support reactions suggest an increasingly stable bullish structure. If buying interest remains steady and volatility stays contained, WSM could extend its advance while gradually reinforcing confidence within the market’s short-term recovery phase.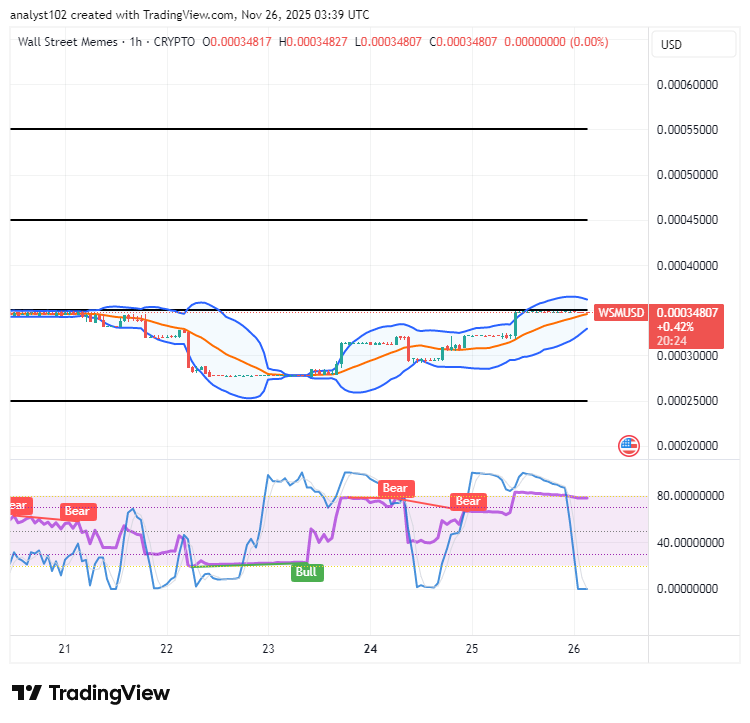
WSM/USD 1-hour chart
The WSM/USD short-term chart reveals that the base-crypto economy is jerking up as sellers lose base.
The Bollinger Bands have remained tactically northward, holding a stable and firm lower base spot with added resilience, clearly signaling potential upward momentum for sustained price movements in the near-term market structure. The Stochastic Oscillators are in the oversold region, suggesting significant buying pressure could emerge soon, potentially triggering a corrective bounce or gradual recovery within the short-term trading range.
Unlock fresh market possibilities and stay ahead of the momentum! Explore new trading opportunities with dynamic leverage options and enhanced automation tools designed for more efficient market participation. Plus, these assets now work with the Bybit Futures Grid Bot, giving experienced users more flexibility and control in their strategies.
BIGTIME: https
WSM: https
#CryptoTrading #Bybit #MarketOpportunities #Innovation
🚀 BIGTIMEUSDT & WSMUSDT Contracts now on Bybit!
— Bybit (@Bybit_Official) October 12, 2023
Dive into new trading opportunities with 1-25x leverage. Plus, they’re now on Bybit Futures Grid Bot! Start trading now.
📈 BIGTIME: https://t.co/FAQlbhnzAh
📈 WSM: https://t.co/pb2y2AfMBE#CryptoTrading #Bybit