Solana (SOL) Price Prediction: SOL/USDT Changes Course After Testing the $123.27 Baseline
Estimated Reading Time: 3 minutes
Don’t invest unless you’re prepared to lose all the money you invest. This is a high-risk investment and you are unlikely to be protected if something goes wrong. Take 2 minutes to learn more
Solana (SOL) Price Prediction: September 20
The Solana market is performing largely as expected, with price action rebounding from the support level of $123.27. Yesterday’s trading activity experienced a strong upward boost, pushing the market above the $140.00 price level.
SOL/USDT Long-term Trend: Bullish (Daily Chart)
Key Price Levels:
Resistance: $140.00, $150.00, $160.00
Support: $120.00, $110.00, $100.00
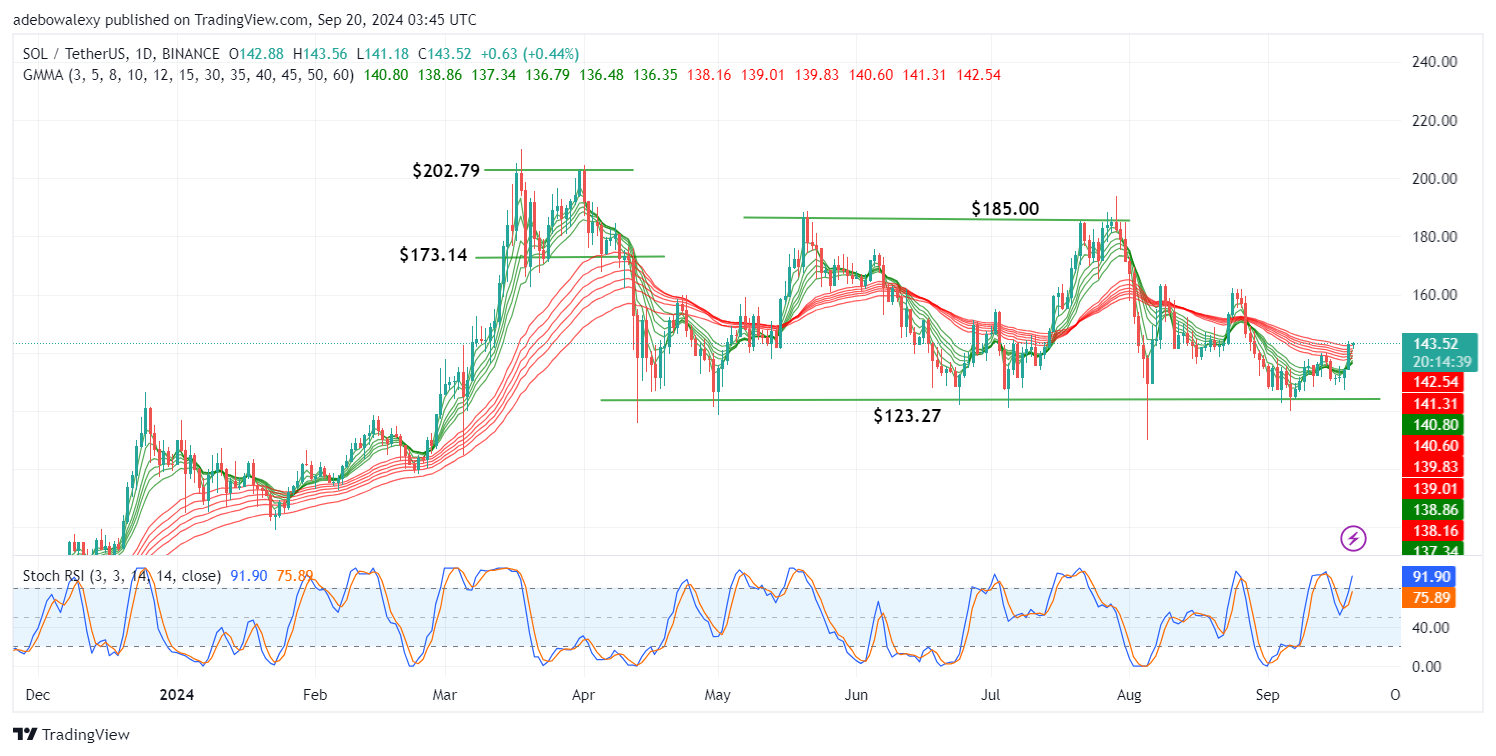
The latest price candle on this chart is green and resembles a hammer-shaped candle. Despite this, it has placed the token’s price above all the Guppy Multiple Moving Average (GMMA) lines. Furthermore, the GMMA lines seem to be in the early stages of a crossover. The Stochastic Relative Strength Index (RSI) lines are progressing upward into the overbought region.
Solana (SOL) Price Prediction: SOL/USDT Market Is Trying to Catch the Trend
Current session in the Solana market suggests that the market is attempting to gain more upward momentum. The ongoing session has pushed the market just above all the GMMA lines, though only slightly. Similarly, the Stochastic RSI lines appear to be in the early stages of an upward crossover, and they are rising in response to the market’s upward trend.
Technically, this supports the likelihood that the token’s price may continue to rise. However, the shape of the last price candle on the daily chart raises concerns about a potential trend reversal. For now, traders may want to wait and see how the market develops in the near term.
Solana (SOL) Price Prediction: SOL/USDT Price Movement Appears Weary (4-Hour Chart)
Price action in the Solana market remains above all the GMMA lines on the 4-hour chart. However, recent sessions seem to show a lack of participation, as reflected by the last price candle. The Stochastic RSI lines have reached the 100 mark but are moving sideways around that level.
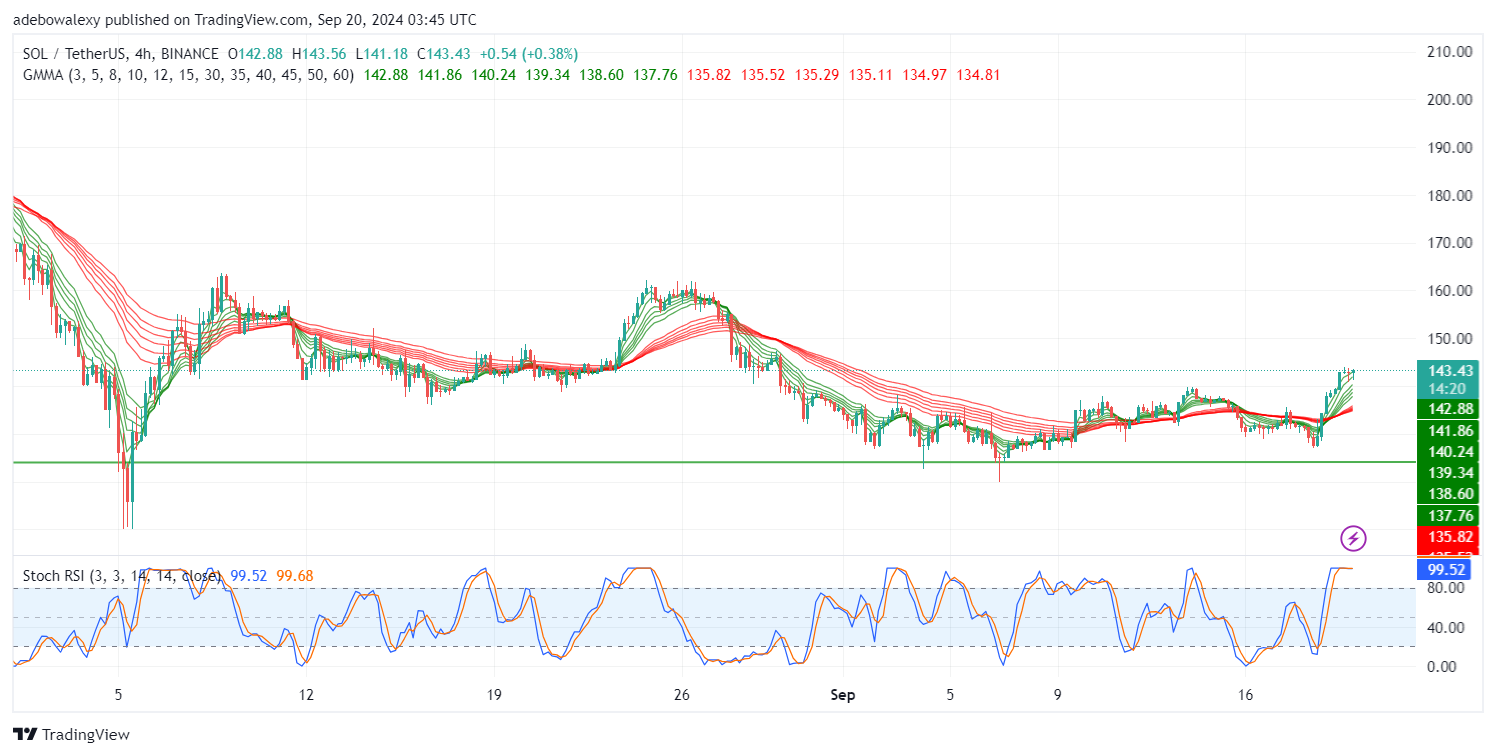
The size of the recent price candle suggests that upward momentum is weakening, even though the market remains above the GMMA lines. The Stochastic RSI lines are also trending sideways at the 100 mark, indicating that the market may lack the momentum to continue moving upward. Despite this, traders may want to watch the $145 threshold to see if price action can rally toward the $150 mark.