Uniswap (UNI) Price Prediction: UNI/USDT Heads Towards the $7.00 Mark
Estimated Reading Time: 3 minutes
Don’t invest unless you’re prepared to lose all the money you invest. This is a high-risk investment and you are unlikely to be protected if something goes wrong. Take 2 minutes to learn more

Uniswap (UNI) Price Prediction: September 19
The Uniswap daily market has been experiencing a prolonged but minimal upside retracement. The most recent retracement began on September 1, when the price action rebounded upwards through the $6.00 threshold. Since then, this market has maintained an upward trajectory but has remained below the $7.00 mark.
UNI/USDT Long-term Trend: Bullish (Daily Chart)
Key Price Levels:
Resistance: $7.00, $8.00, $9.00
Support: $6.00, $5.00, $4.00
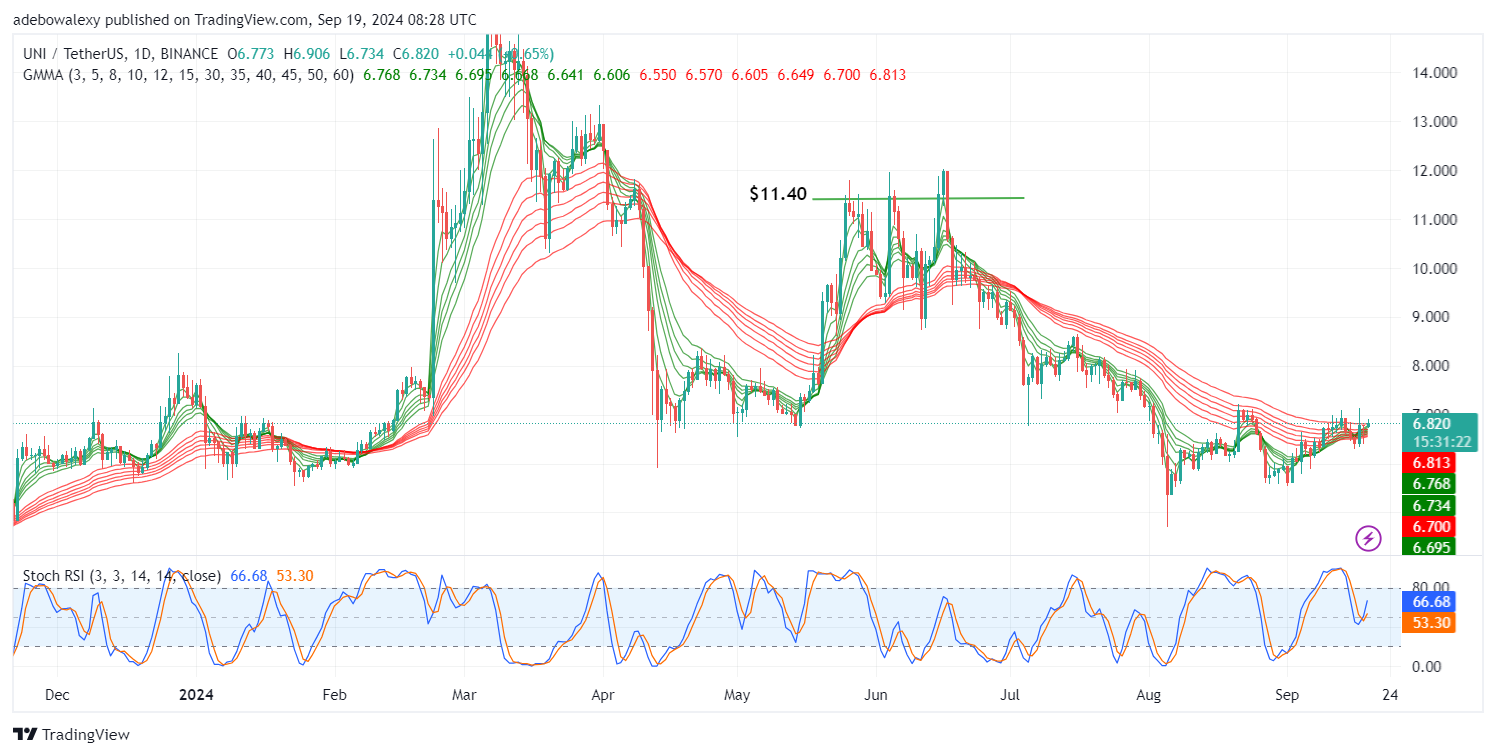
The last price candle on the chart has placed the current price of the Uniswap token above most of the Guppy Multiple Moving Average (GMMA) curves. However, the same price candle shows an upper shadow while remaining green in color. Simultaneously, the Stochastic Relative Strength Index (Stochastic RSI) continues its upward crossover, with its lines rising past the 50 mark of the indicator.
Uniswap (UNI) Price Prediction: UNI/USDT Upside Retracement Is Already Facing Challenges in the Session
Despite the limited volatility of prices, the Uniswap token has continued to rise. Although, as noted earlier, the market hasn’t moved very quickly, upside forces seem to be making progress. The last price candle on the daily chart appears to be on a promising support level with the GMMA lines crossing.
At the same time, the Stochastic RSI lines continue to rise upward going by the prevailing market trend. Given the current position of the corresponding price candle in the ongoing session, bullish speculation appears likely among traders in this market.
Uniswap (UNI) Price Prediction: UNI/USDT May Still Hit the $7.00 Mark (4-Hour Chart)
Trading activity on the UNI/USDT 4-hour market remains largely above all the GMMA indicator lines. However, the downward contraction previously noted has been further revealed. The last two price candles on the chart are still above most of the GMMA lines. Additionally, the previous price candle is now testing the highest GMMA lines as a support level. There is also a convergence in the Stochastic RSI lines.
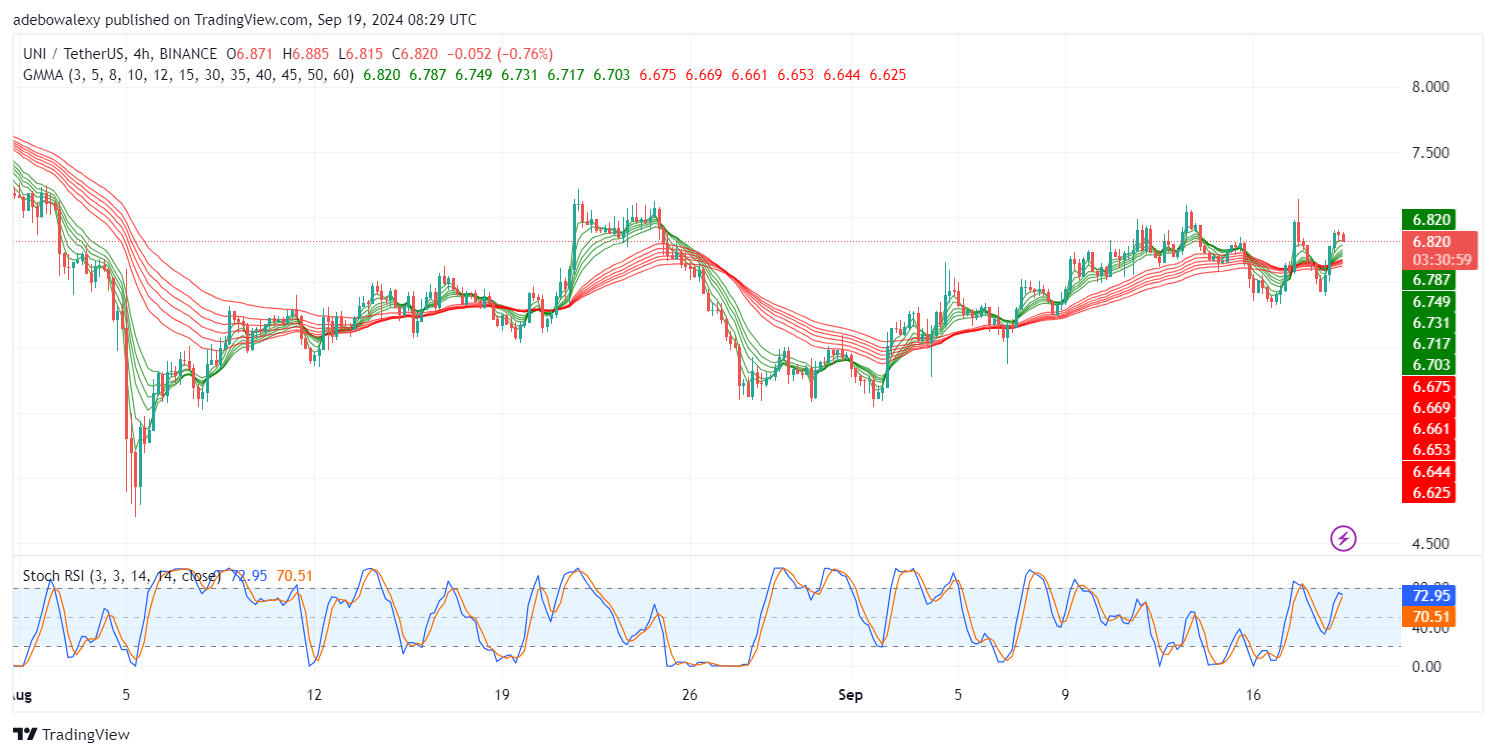
Should the convergence of this indicator line eventually occur, prices may descend lower. Here, the market has been retracing to lower levels since the previous session and now threatens to fall below more GMMA lines. At this point, traders can anticipate a potential decline to the $6.50 mark, with a possibility of upside forces resuming action before potentially pushing the market through the $7.00 mark.