Bitcoin (BTC) Price Prediction: BTC/USDT Crosses the $60,000 Threshold
Estimated Reading Time: 3 minutes
Don’t invest unless you’re prepared to lose all the money you invest. This is a high-risk investment and you are unlikely to be protected if something goes wrong. Take 2 minutes to learn more

Bitcoin (BTC) Price Prediction: September 18
Price activity on the Bitcoin daily chart has risen through the $60,000 threshold, even if only by a whisker. However, the current position of the market maintains the possibility of prices rising further. This suggests that the market may convincingly surpass the $60,000 price level.
BTC/USDT Long-term Trend: Bullish (Daily Chart)
Key Price Levels:
Resistance: $60,000, $65,000, $70,000
Support: $60,000, $55,000, $50,000
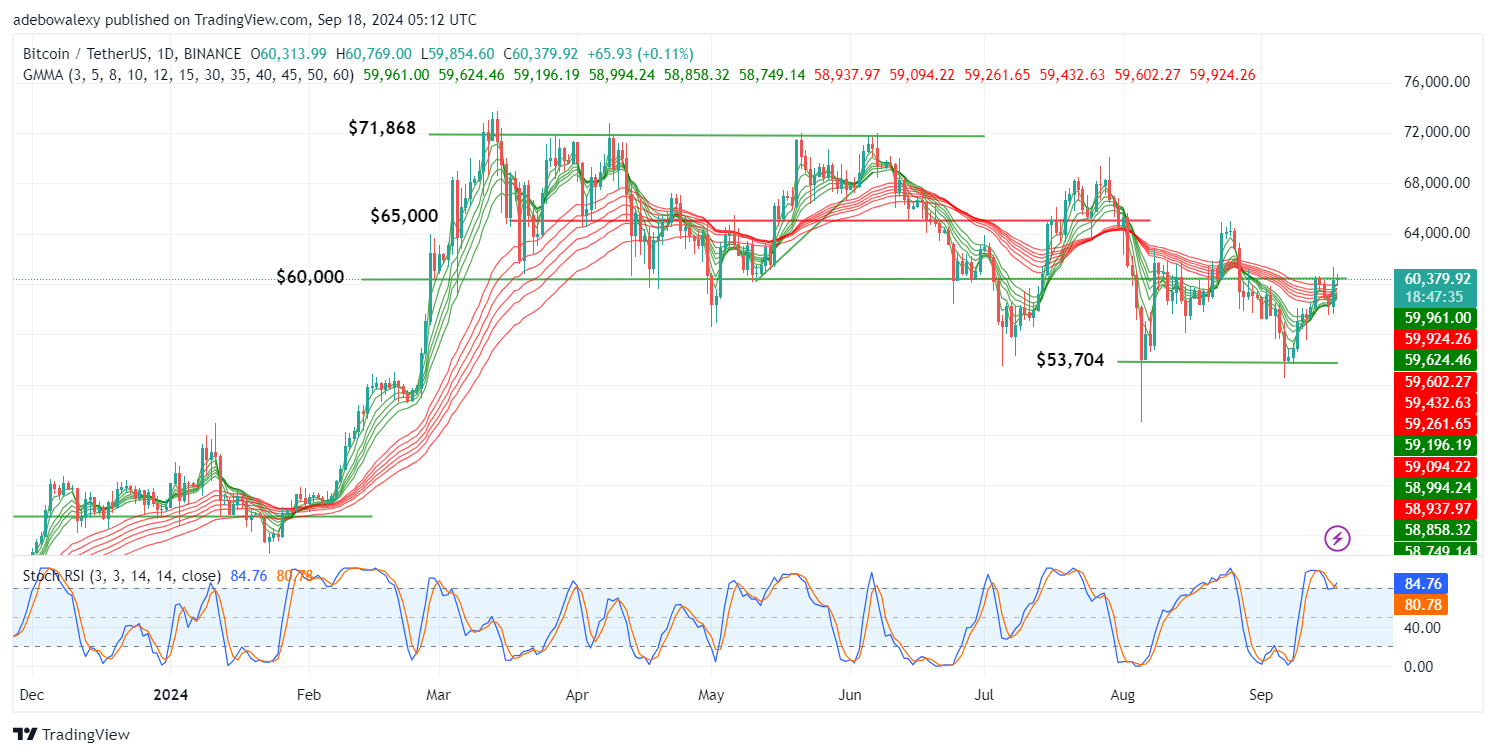
The ongoing session on Bitcoin’s daily price chart shows the market moving through the $60,000 threshold. The lines of the Guppy Multiple Moving Average (GMMA) indicator are now below the price activity, and the GMMA lines have crossed each other below the price action. Similarly, the Stochastic Relative Strength Index (Stochastic RSI) curves have delivered an upside crossover at the 80 mark.
Bitcoin (BTC) Price Prediction: Will the BTC/USDT Upside Retracement Continue?
Price activity on the daily chart hints at the possibility of a continued upward retracement. Although the last price candle resembles a spinning top, it has placed the market above the $60,000 mark.
Coupled with the fact that price activity is now above all the GMMA indicator lines, the market seems to be aligning for bullish activity. Additionally, the Stochastic RSI lines have delivered an upside crossover just at the 80 level of the indicator. Technically, all available signs suggest that more price increases may be seen.
Bitcoin (BTC) Price Prediction: BTC/USDT Maintains Strong Position But Faces Early Rejection (4-Hour Chart)
While the daily chart remains positive, the BTC/USDT 4-hour chart shows a shift from the earlier conclusion. The last price candle appeared red, suggesting that downward forces have had some effect. However, it is important to note that despite this, the price action remains above all the GMMA lines. Additionally, despite the rejection, the Stochastic RSI line has converged for a new upside crossover just below the 80 level of the indicator.
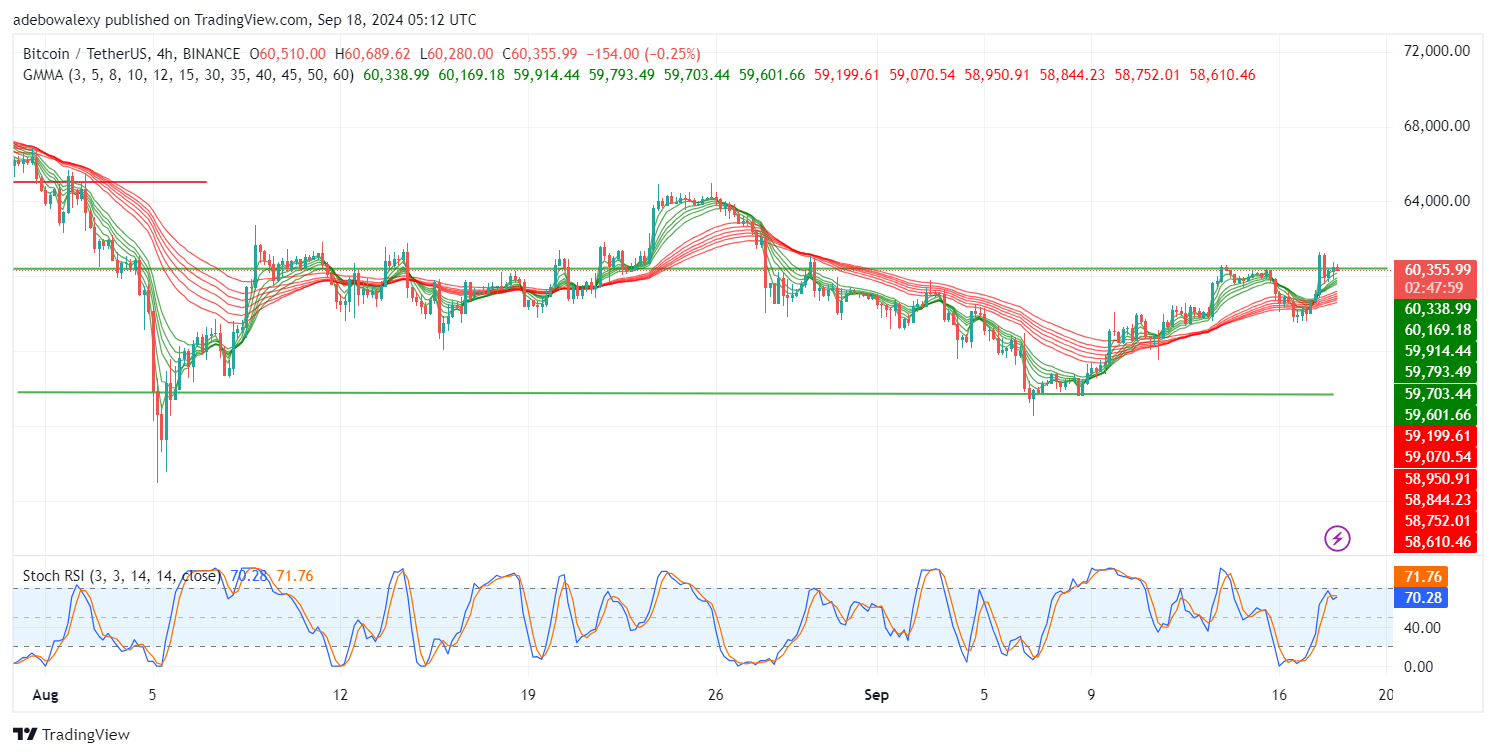
The position of the price action above the GMMA indicator lines suggests that price activity may still have the potential to resume upward corrections. Meanwhile, the convergence of the Stochastic RSI indicator lines may provide additional upward momentum. Therefore, traders can still aim for targets around the $62,500 mark for short-term gains in this market.