Band Protocol (BANDUSD) Keeps Falling Under the Strain of the Bears
Estimated Reading Time: 2 minutes
Don’t invest unless you’re prepared to lose all the money you invest. This is a high-risk investment and you are unlikely to be protected if something goes wrong. Take 2 minutes to learn more
BANDUSD Analysis – The Market Keeps Falling Under the Strain of the Sellers
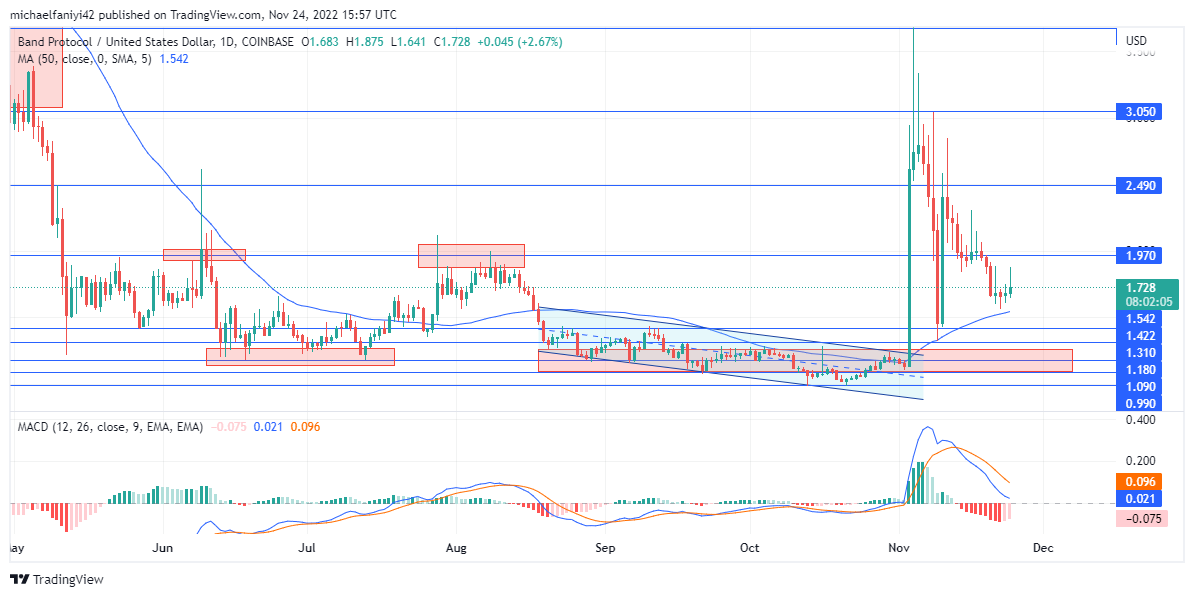
BANDUSD keeps falling under the strain of the sellers. After a prolonged period of price accumulation, Band Protocol experienced a spike in its market that rose as high as $3.670. The question has always been how the coin will maintain such an incredible price increase in light of the global bearish state of cryptocurrencies. True enough, the coin has been feeling the weight and keeps dropping.
BANDUSD Key Zones
Resistance Zones: $3.670, $3.050, $2.490
Support Zones: $1.970, $1.090, $0.990
After a strong dip in the market at the middle of the year, the market has been tugging upward in a bid to at least stop the plunging. With this, they were somehow able to structure the price chart into something that looks like a double-bottom bullish reversal structure. The structure was fully formed by early November when the spike was complete and the structure was executed.
The coin rose to $3.670 but immediately fell back below $3.050. Since then, the price has been trying to maintain its position while bearing the strain from the sellers’ activities. Eventually, the market dropped below two more key levels to find itself below $1.970. The buyers still harbor hope of a price rise, especially with the MA period 50 (Moving Average) below the candles. The MACD (Moving Average Convergence Divergence) likewise remains above the zero level.
Market Expectations
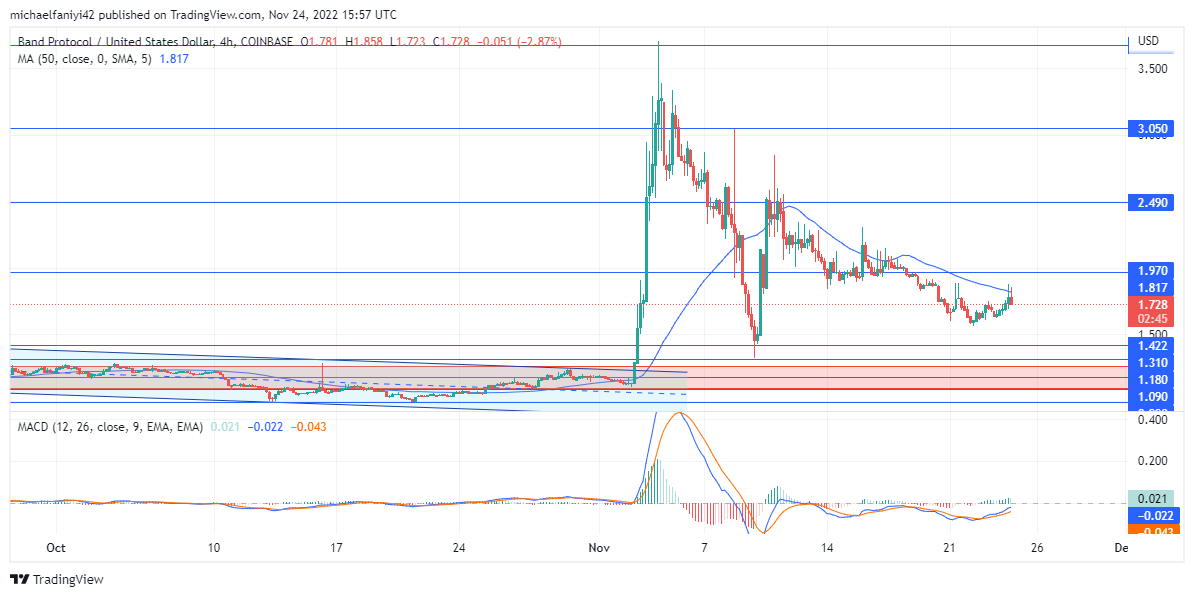
Things are looking gloomier on the 4-hour chart. The market is depicted as already being subjected to the sellers’ whims. Despite a couple of trials, the coin couldn’t get back above the $1.970 key level at first. The MA period 50 is hanging above the market, indicating a bearish outlook, while the MACD lines are undulating just below the zero level. The bearish pressure might eventually lead to a drop in the price back to the range zone of around $1.180.
You can purchase Lucky Block here. Buy LBLOCK
Note: Cryptosignals.org is not a financial advisor. Do your research before investing your funds in any financial asset or presented product or event. We are not responsible for your investing results.