Ripple Is in a Narrow Range as It Declines to the $0.35 Low
Estimated Reading Time: 2 minutes
Don’t invest unless you’re prepared to lose all the money you invest. This is a high-risk investment and you are unlikely to be protected if something goes wrong. Take 2 minutes to learn more
Ripple (XRP) Long-Term Analysis: Bearish
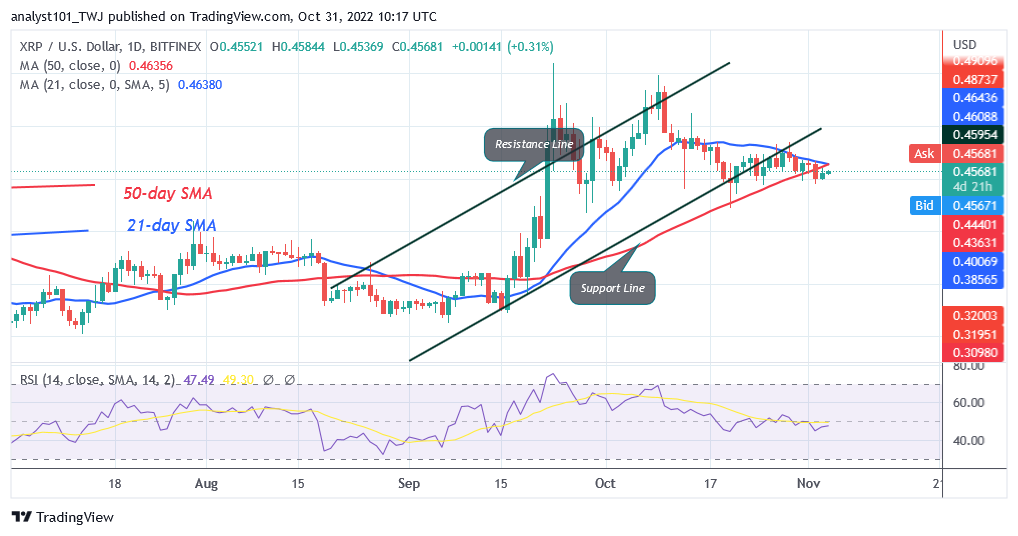
Ripple’s (XRP) price is in a sideways move below the moving average lines as it declines to the $0.35 low. Since October 20, the cryptocurrency has been stuck between the moving average lines. The selling pressure could increase if the price drops below the 50-day SMA. The altcoin is currently correcting upward to retest the moving average lines. If XRP declines from the moving average lines, the selling pressure will pick up again. If the bears’ breach is below the $0.41 support, XRP will decline to a low of $0.35. In a similar vein, if buyers keep the price above the 21-day line SMA, the market will increase to its prior high of $0.54.
Ripple (XRP) Indicator Analysis
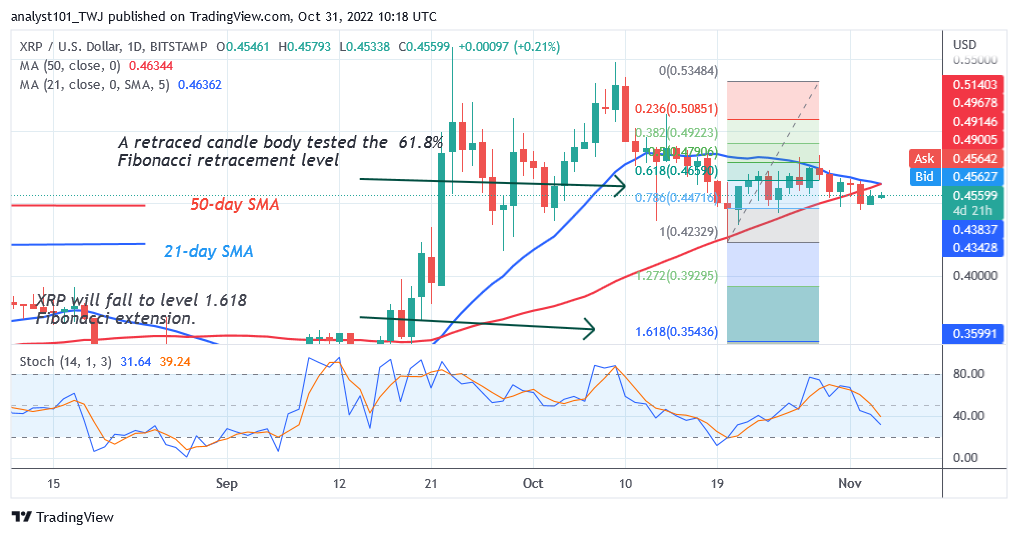
In period 14 of the Relative Strength Index, Ripple is at level 47. It suggests that XRP is in a downtrend and could continue to decrease. XRP is below the daily Stochastic’s 40% range. The momentum of the coin is bearish. The upward-sloping moving average lines show the prior trend.
Technical indicators:
Major Resistance Levels – $2.00, $2.50, $3.00
Major Support Levels – $1.50, $1.00, $0.50
What Is the Next Direction for Ripple (XRP)?
Following its rejection at $0.54 or the high $0.48, Ripple declines to the $0.35 low. XRP had an upward corrective during the October 20 decline, and a candle body tested the 61.8% Fibonacci retracement level. According to the correction, XRP will drop to $0.35, or level 1.618 of the Fibonacci extension.
You can purchase crypto coins here. Buy LBLOCK
Note: Cryptosignals.org is not a financial advisor. Do your research before investing your funds in any financial asset or presented product or event. We are not responsible for your investing results