Ripple Is Confined in a Range but Risks Further Decline to $0.34
Estimated Reading Time: 2 minutes
Don’t invest unless you’re prepared to lose all the money you invest. This is a high-risk investment and you are unlikely to be protected if something goes wrong. Take 2 minutes to learn more
Ripple (XRP) Long-Term Analysis: Bearish
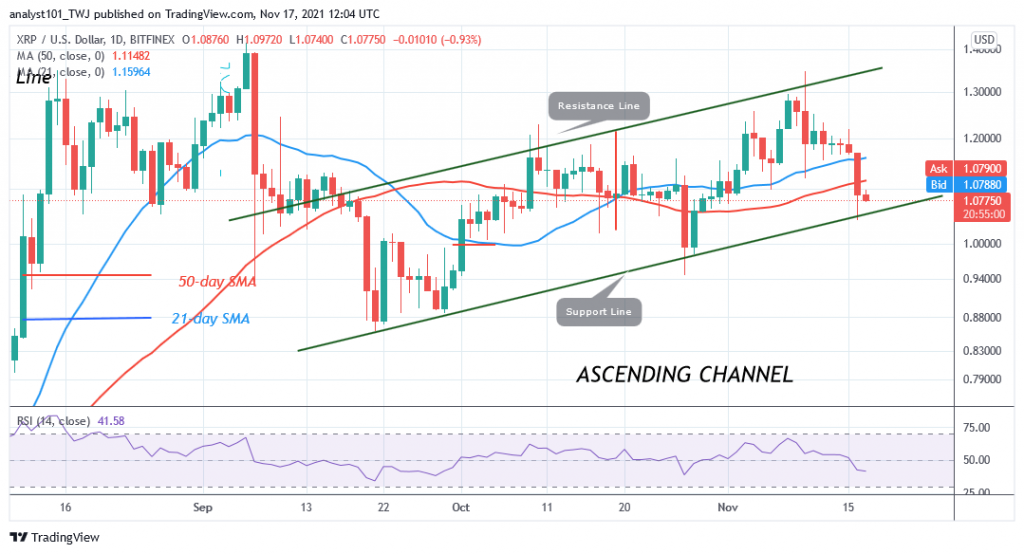
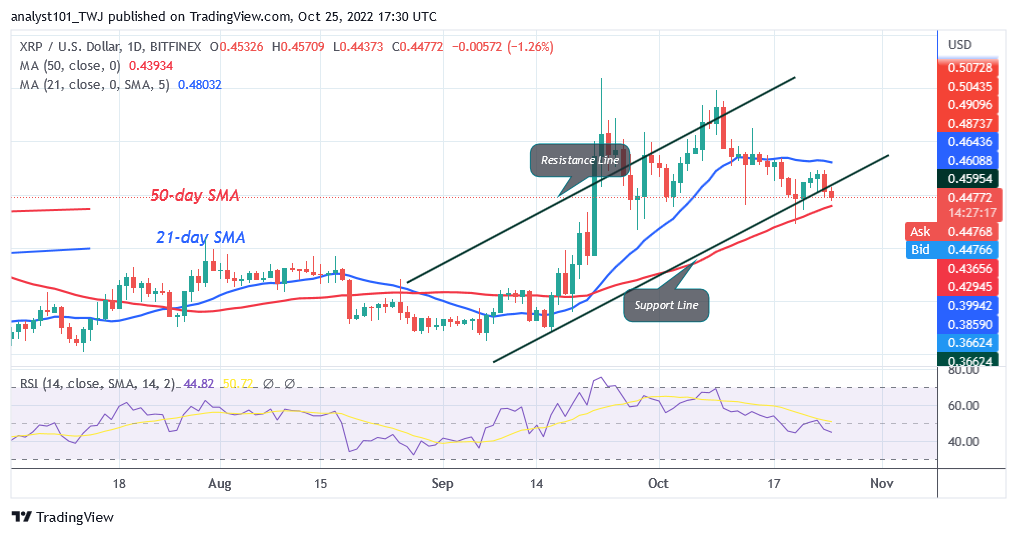
At the time of writing, Ripple’s (XRP) price has risen to a high of $0.47 but risks further decline to $0.34. After attaining its recent high of $0.54, the cryptocurrency has been falling. XRP has fallen to the 50-day line SMA after breaking below the 21-day line SMA. Since October 13, the crypto’s price has been fluctuating between the moving average lines.XRP will trend once the range-bound levels are crossed. For instance, if the bears pass the 50-day line SMA, XRP will fall to its low of $0.38. Above the 50-day SMA, it seems unlikely that XRP will find support. If XRP finds support above the 50-day line SMA, the downtrend might cease.
Ripple (XRP) Indicator Analysis
Ripple has retraced to level 48, according to the Relative Strength Index for period 14. Ripple may resume its range-bound behavior as long as the price bars stay in between the moving average lines. Below the daily Stochastic’s 40% region, XRP is experiencing a bearish momentum.
Technical indicators:
Major Resistance Levels – $2.00, $2.50, $3.00
Major Support Levels – $1.50, $1.00, $0.50
What Is the Next Direction for Ripple (XRP)?
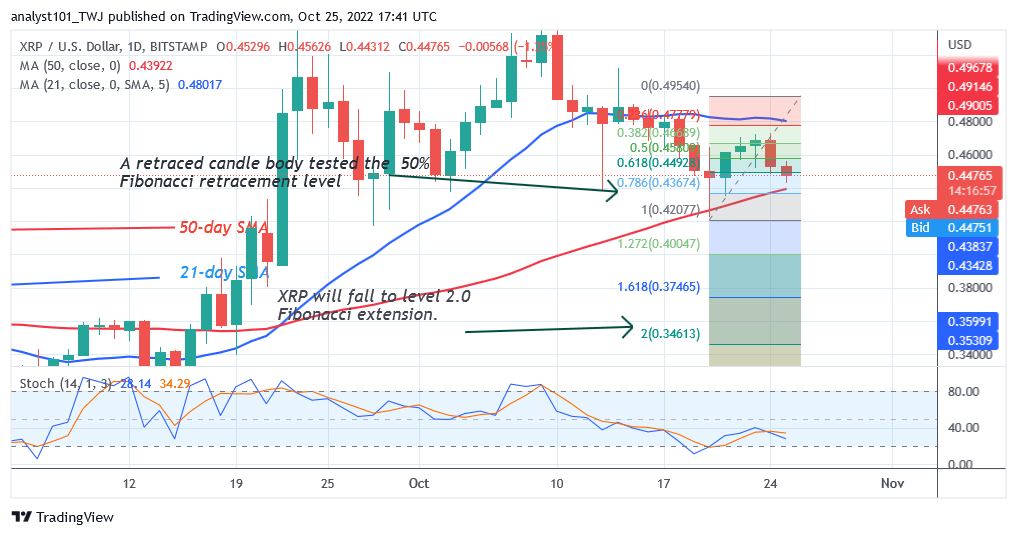
Ripple (XRP) pricehas dipped to its prior low but risks further decline to $0.34. Following a downward correction on October 20, XRP’s candle body tested the 50% Fibonacci retracement level. According to the correction, XRP will drop to level 2.0 of the Fibonacci extension, or $0.34.
You can purchase crypto coins here. Buy LBLOCK
Note: Cryptosignals.org is not a financial advisor. Do your research before investing your funds in any financial asset or presented product or event. We are not responsible for your investing results