XRP Loses Value as It Faces Another Rejection At $0.55
Estimated Reading Time: 2 minutes
Don’t invest unless you’re prepared to lose all the money you invest. This is a high-risk investment and you are unlikely to be protected if something goes wrong. Take 2 minutes to learn more

XRP (XRP) Long-Term Analysis: Bearish
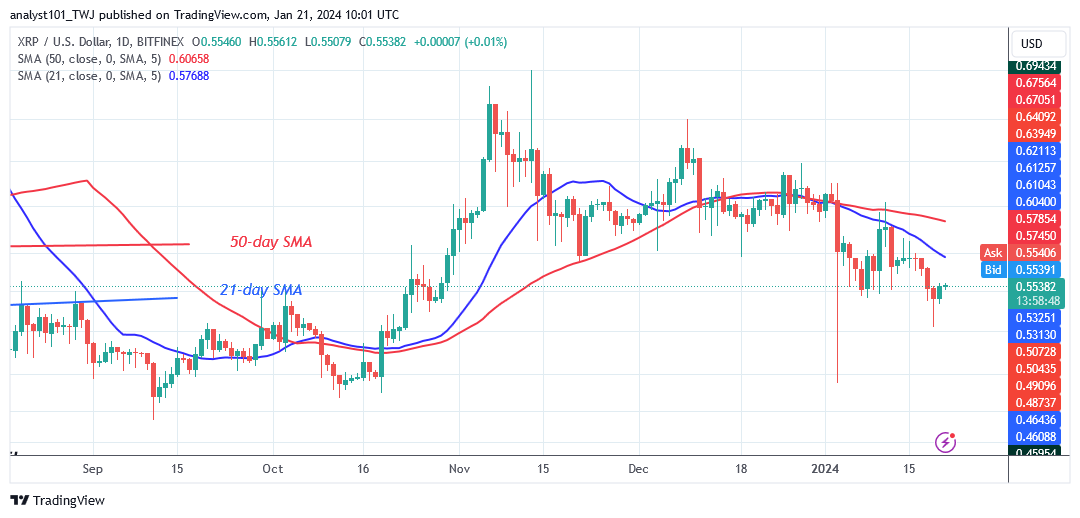
The XRP (XRP) price is trading below the moving average lines as it faces another rejection at $0.55. On January 3, 2024, XRP rallied to a low of $0.48, yet bulls bought on dips. The altcoin experienced an upward correction, which ended at a high of $0.62. Today, the altcoin is trading above the $0.54 support level but below the moving average.
The cryptocurrency is now worth $0.55. On January 19, the altcoin fell to a low of $0.52 before pulling back. Today, XRP is heading upward to retest the resistance at $0.60, or the moving average. However, the upward move is doubtful as the altcoin faces rejection at the recent high. Nonetheless, if the bears break below the $0.54 support level, the market will fall and find support above the previous low of $0.48.
Technical Indicators:
Major Resistance Levels – $1.00, $1.50, $2.00
Major Support Levels – $0.50, $0.30, $0.10
XRP(XRP) Indicator Analysis
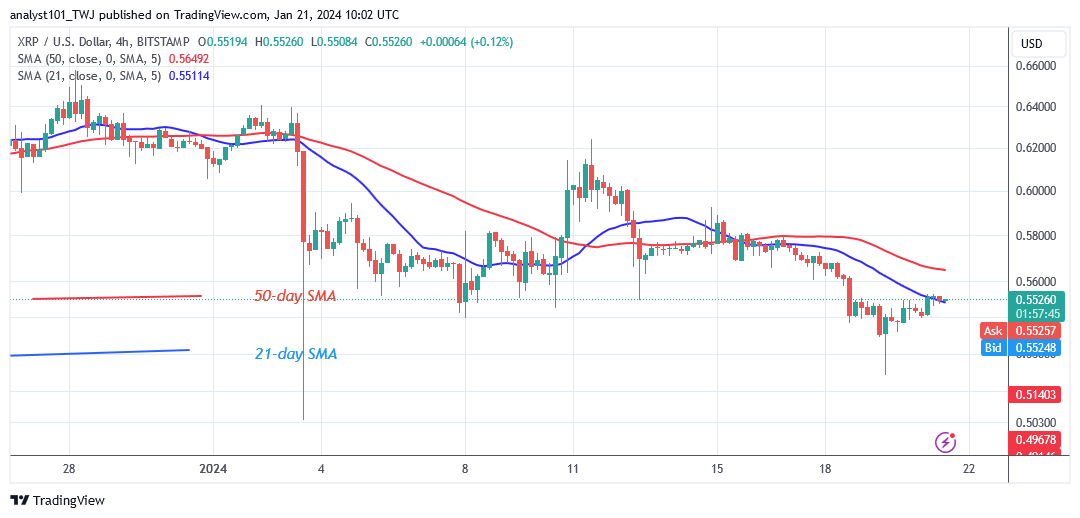
XRP price bars are displayed below the moving average lines in both charts. This suggests that the coin may be losing value. The crypto asset shows a bearish crossover, with the 21-day $MA crossing below the 50-day SMA. This also suggests that the cryptocurrency will continue to plummet. Doji candlesticks are currently slowing the price movement.
What Is the Next Direction for XRP (XRP)?
The selling pressure has increased as it faces another rejection at $0.55. Today, the upward corrective is being rejected by the 21-day SMA. Meanwhile, XRP/USD is trading within a small range of $0.54 to $0.58. Doji candlesticks have slowed price movement.
You can purchase crypto coins here. Buy LBLOCK
Note: Cryptosignals.org is not a financial advisor. Do your research before investing your funds in any financial asset or presented product or event. We are not responsible for your investing results