Lucky Block Price Prediction: LBLOCK/USD Jumps Above $0.0020 Level
Estimated Reading Time: 3 minutes
Don’t invest unless you’re prepared to lose all the money you invest. This is a high-risk investment and you are unlikely to be protected if something goes wrong. Take 2 minutes to learn more

Free Crypto Signals Channel
The Lucky Block price prediction touches the resistance level of $0.0020 as the coin targets $0.0025 high above the upper boundary of the channel.
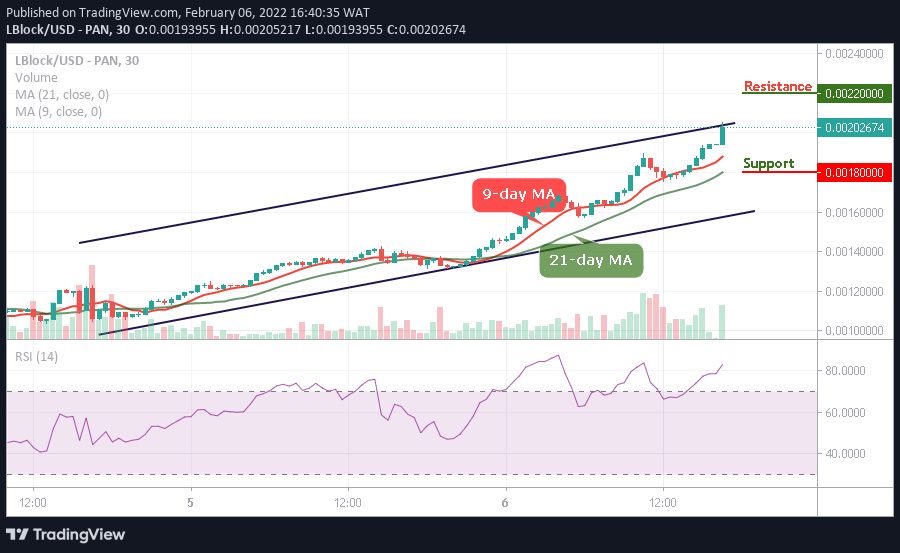
LBLOCK/USD Long-term Trend: Bullish (30 Minutes Chart)
Key Levels:
Resistance levels: $0.00220, $0.00225, $0.00230
Support levels: $0.00180, $0.00175, $0.00170
LBLOCK/USD is moving higher above the 9-day and 21-day moving averages to continue the bullish movement as the Lucky Block price still sits above $0.0020 as a near $0.0022 peak would come into focus.
Lucky Block Price Prediction: LBLOCK Ready to Gain More
According to the daily chart, traders could see that the Lucky Block price converges above the moving averages as the 9-day MA trend-line is currently above the 21-day moving average to create more upsides, the technical indicator Relative Strength Index (14) moves within the overbought region to sustain the bullish movement.
However, a clear break above the $0.0021 level will set the pace for increases to $0.00220, $0.00225, and $0.00230 resistance levels. Meanwhile, should the coin retreat below the $0.0020 resistance, it could start a new decline towards the support levels of $0.00180, $0.00175, and $0.00170 as the new buyers would have the opportunity to enter the market while the existing buyers will buy the dips
LBLOCK/USD Medium-term Trend: Bullish (15 Minutes Chart)
According to the 15-minute chart, LBLOCK/USD remains bullish as the market continues to show a sign of a bullish trend since the daily opening. In addition, the intraday trading is still looking bullish; any further upward movement could hit the resistance level of $0.00215 and above.
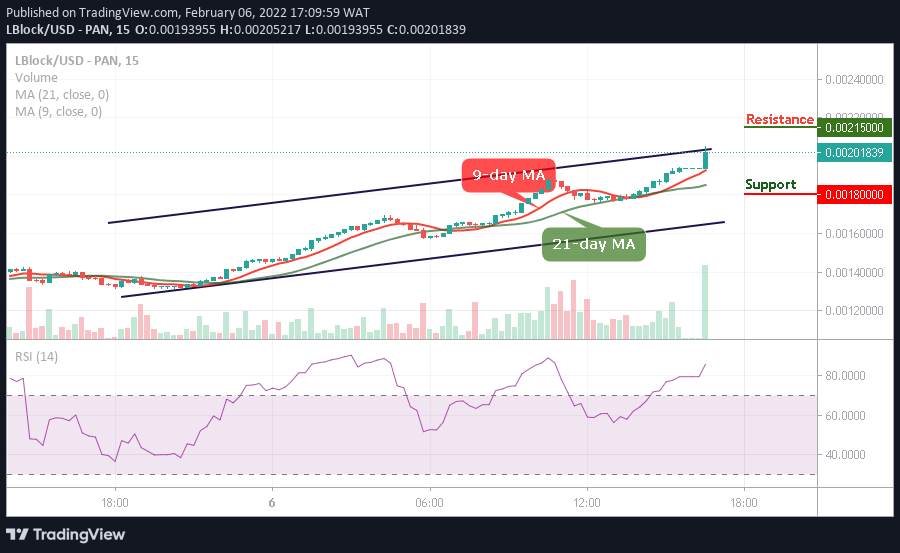
However, any bearish movement below the 9-day and 21-day moving averages is likely to locate the critical support at $0.00180 and below. The Lucky Block price will cross above the upper boundary of the channel. Now, the Relative Strength Index (14) faces the upside to confirm more bullish signals.
Read more: