Lucky Block Price Prediction: Price Will Continue Rising As Bulls Increase Pressure
Estimated Reading Time: 2 minutes
Don’t invest unless you’re prepared to lose all the money you invest. This is a high-risk investment and you are unlikely to be protected if something goes wrong. Take 2 minutes to learn more

Free Crypto Signals Channel
The last few minutes have been tremendous for the Lucky Block price prediction as the coin gets ready to move above $0.00110 resistance level.
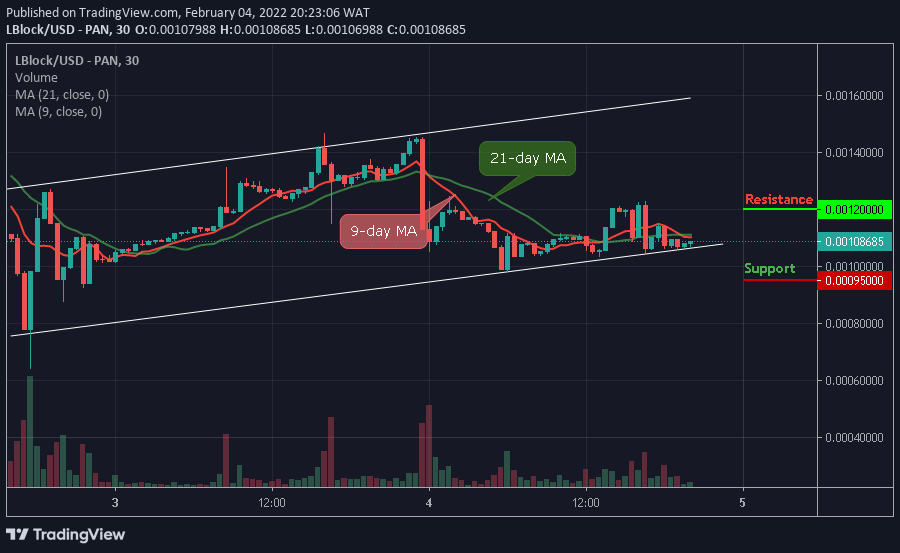
LBLOCK/USD Long-term Trend: Bullish (30 Minutes Chart)
Key Levels:
Resistance levels: $0.00120, $0.00125, $0.00130
Support levels: $0.00095, $0.00090, $0.00085
LBLOCK/USD market keeps moving in an ascending broadening wedge, following a bullish scenario which reveals that the Lucky Block price is trading above the crucial levels that will function as the support zones if a reversal occurs.
Lucky Block Price Prediction: LBLOCK Focuses at The Upside
The chart above shows that the Lucky Block price hovers well in an upward movement as the coin gets ready for a cross above the 9-day and 21-day moving averages that could push the price cross above $0.00110. Any further bullish move could hit the resistance levels of $0.00120, $0.00125, and $0.00130.
More so, the Lucky Block price may fall slightly to touch the supports at $0.00095, $0.00090, and $0.00085, but once this occurs, new Buyers are to come into the market while the existing buyers are to buy more.
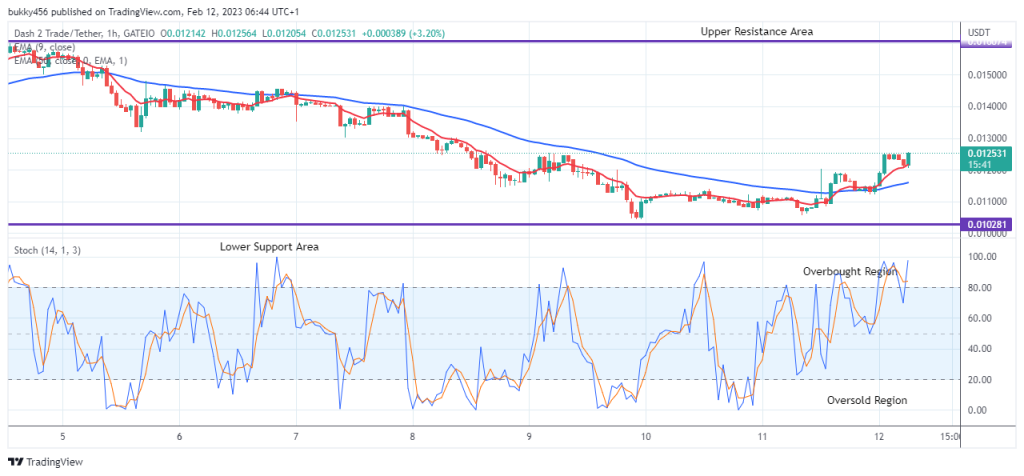
LBLOCK/USD Medium-term Trend: Bullish (15 Minutes Chart)
At the 15-minute chart, LBLOCK/USD breaks above the 9-day and 21-day moving averages, marking a new high for the coin at $0.00110. However, it is now time for more buyers to come into the market as the Lucky Block prepares to hit the resistance level of $0.00125 and above.
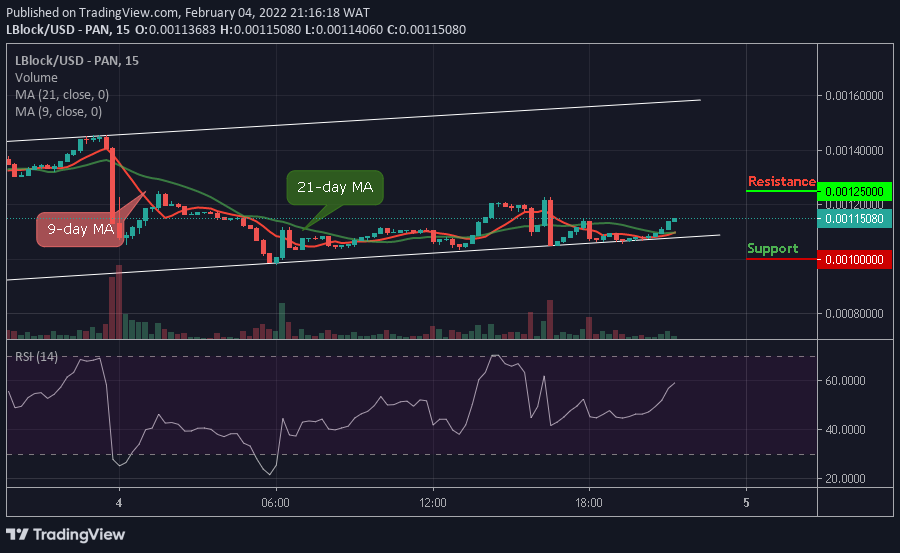
Moreover, LBLOCK/USD may slide below the channel to locate the support at $0.00100 and below. However, the LBLOCK may retreat to give more investors a chance to re-invest and accrue more gains as the technical indicator Relative Strength Index (14) moves to cross above 60-level.
Read more: