Cardano Holds above $0.34 as It Begins It’s Sideways Move
Estimated Reading Time: 2 minutes
Don’t invest unless you’re prepared to lose all the money you invest. This is a high-risk investment and you are unlikely to be protected if something goes wrong. Take 2 minutes to learn more

Cardano (ADA) Price Long-Term Forecast: Bullish
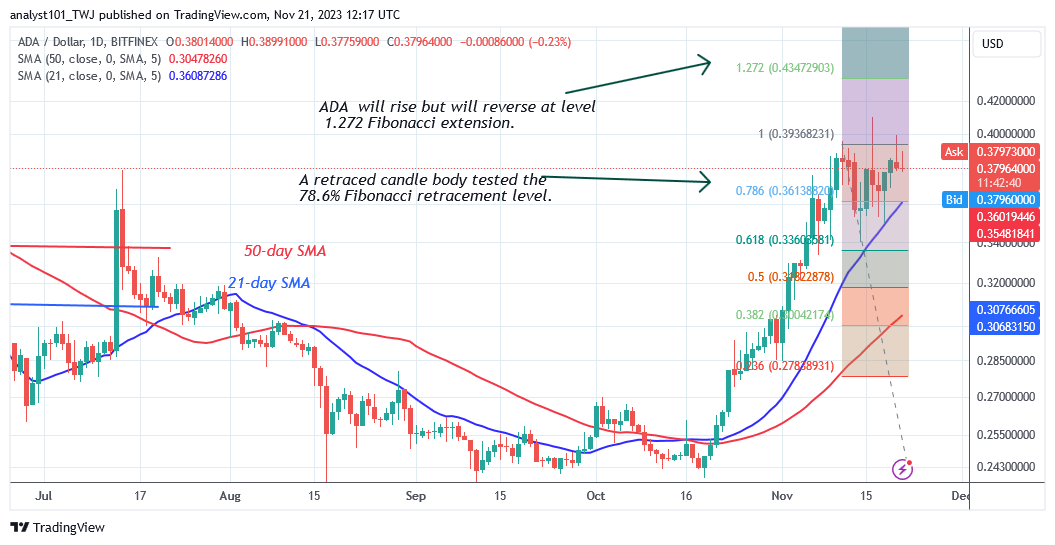
Cardano’s (ADA) price has been rising since November 11 but begins it’s sideways move . The uptrend was terminated after reaching the high of $0.395. The cryptocurrency plummeted to a low of $0.34 and began a sideways movement. Cardano has been trading between $0.34 and $0.40 during the last week.
The resistance at $0.40 has stifled the cryptocurrency’s further upward movement. On the downside, the bulls have consistently held the present support level of $0.34. In the middle of the price range, ADA/USD is trading at $0.36.
Technical Indicators:
Major supply zones: $1.0, $1.05, $1.10
Major demand zones: $0.25, $0.20, $0.15
Cardano (ADA) Indicator Analysis
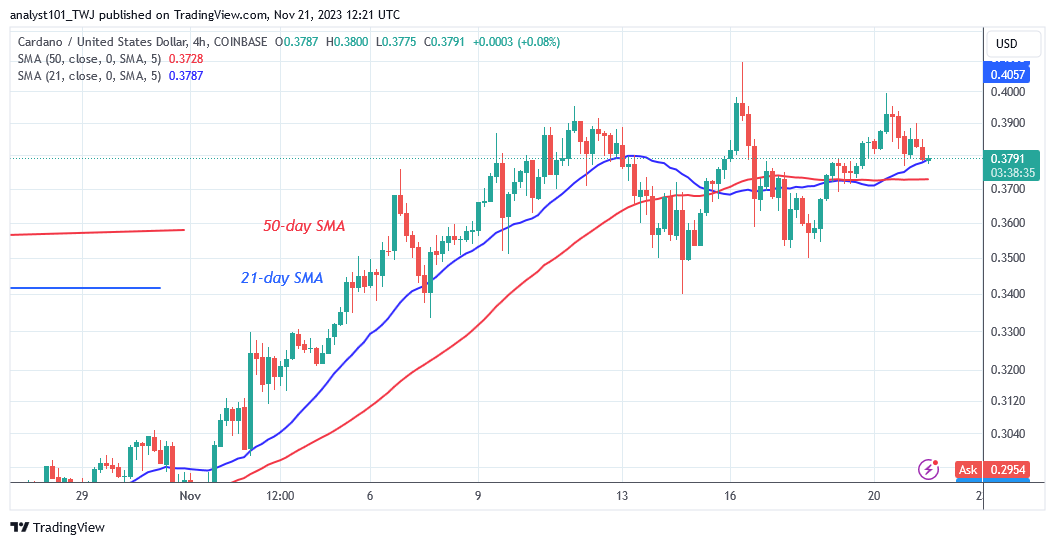
Price bars oscillate below and above the horizontal sloping moving average lines on the 4-hour chart. The price bars on the daily chart are still trapped above the moving average lines. When the price bars fall below the moving average lines, Cardano will fall.
What Is the Next Move for Cardano (ADA)?
Cardano trades below the $0.40 high as it begins it’s sideways move . The altcoin is trading in the market’s overbought zone. Price increases are unlikely to continue. Cardano will fall if it loses the $0.34 support level or the bears break below the 21-day simple moving average.
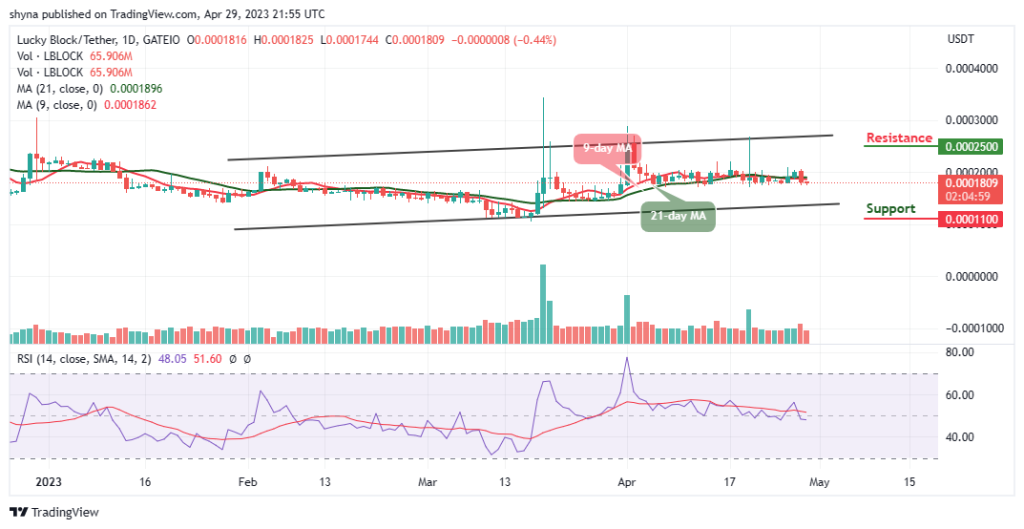
You can purchase crypto coins here. Buy LBLOCK
Note: Cryptosignals.org is not a financial advisor. Do your research before investing your funds in any financial asset or presented product or event. We are not responsible for your investing results