Bitcoin (BTC/USD) Market Aims to Increase Valuation
Estimated Reading Time: 3 minutes
Don’t invest unless you’re prepared to lose all the money you invest. This is a high-risk investment and you are unlikely to be protected if something goes wrong. Take 2 minutes to learn more
Bitcoin Price Prediction – August 22
The BTC/USD market aims to increase valuation as the crypto’s price trades around the line of $49,411. The trading rate of percentage is at 0.59 as of writing. That showcases that the market has somewhat got a slight reduction at the capacity it’s been pushing to the moon side.
BTC/USD Market
Key Levels:
Resistance levels: $52,500, $55,000, $57,500,
Support levels: $45,000, $42,500, $40,000
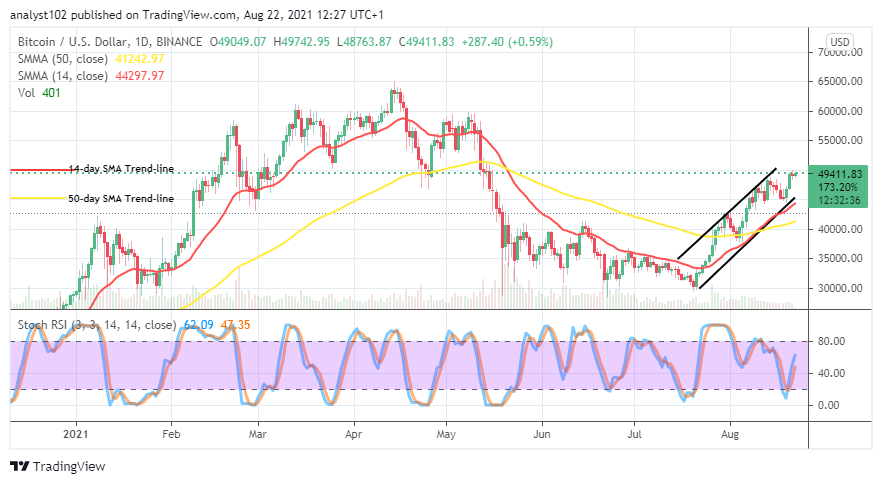
BTC/USD – Daily Chart
The BTC/USD daily chart shows that the crypto market aims to increase the valuation of its trading activities within the purview of the bullish channel trend lines drawn. The smaller SMA and the lower bullish channel trend lines play a vital role in where price has been finding decent support. The Stochastic Oscillators have crossed the lines northbound, seemingly placed between ranges of 40 and 80. That portends that the market’s journey to the north is to some extent in focus.
Will there soon be a successful breakout at the $50,000 line as the crypto market aims increasing valuation?
The end formation of today’s trading Japanese candlestick will give insightful futuristic happenings of the subsequent sessions. If it eventually completes as a full-body bullish stick, the market may in no time extend valuation to higher points above $50,000. However, a pit stop may come to play around the line so that some downward pulls may end in creating some levels of support for bulls.
On the downside, the points around $50,000 and $52,500 could be the trading areas where the crypto’s price tends to shelve active motion. In the meantime, variant smaller-ups and smaller-downs are bound to occur in the short or medium terms. In the light of that, it would be necessary that traders stay abreast of when an active price move has a higher probability of reversing at a higher trading line on either a 1-hour or 4-hour chart to decide a sell entry. And, like wisely, intending traders willing to launch a long position should be on the lookout for a formation of candlestick at lower trading on either of the time frames earlier mentioned to take action when a bullish candlestick tends to form with active motion.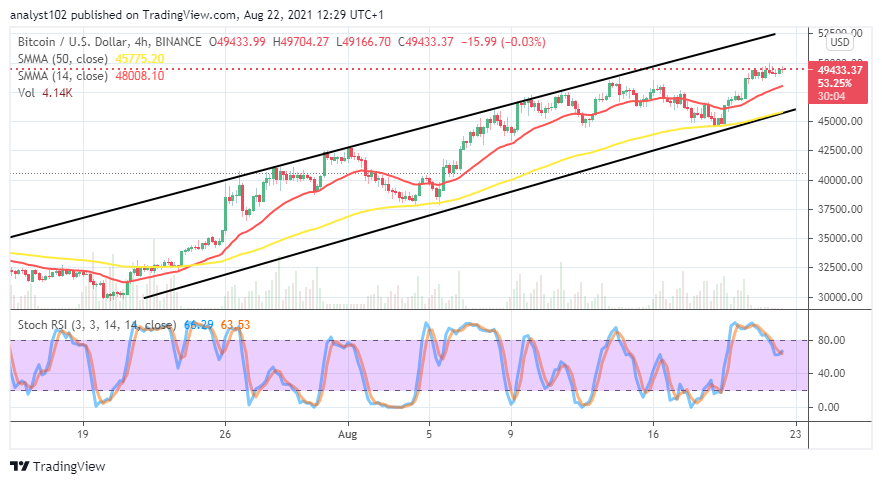
BTC/USD 4-hour Chart
The BTC/USD 4-hour chart shows that the market aims increasing valuation within the well-defined bullish channel trend lines. It equally shows variant price retracements in the channels. The 14-day SMA indicator is over the 50-day SMA indicator. The Stochastic Oscillators have slantingly moved southbound from the overbought region, seemingly trying to close the lines a bit below the range of 80. If the trend-line of 14-day SMA breaches downward by price action, it could be that the crypto’s valuation may experience a line of declines.
Note: Cryptosignals.org is not a financial advisor. Do your research before investing your funds in any financial asset or presented product or event. We are not responsible for your investing results.
You can purchase crypto coins here. Buy Tokens