Litecoin (LTC/USD) Market Operation Rallies at $125
Estimated Reading Time: 3 minutes
Don’t invest unless you’re prepared to lose all the money you invest. This is a high-risk investment and you are unlikely to be protected if something goes wrong. Take 2 minutes to learn more

Free Crypto Signals Channel
Litecoin Price Prediction – February 15
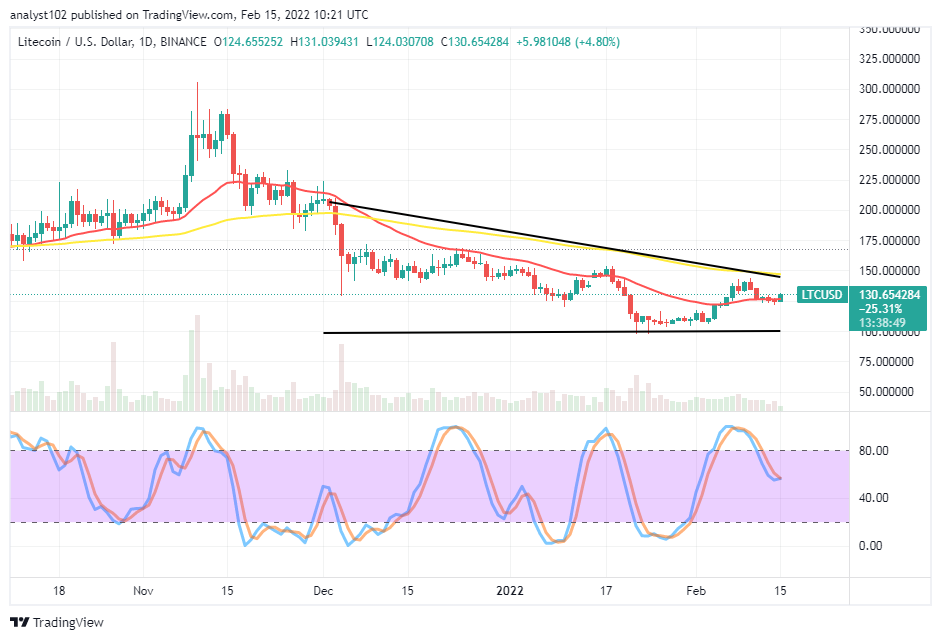
It occurred on the LTC/USD financial book of records that the crypto-economic market operation rallies at $125 to trade between $131 and $124 lines. The trade percentage rate is at 4.80 positives.
LTC/USD Market
Key Levels:
Resistance levels: $150, $160, $170
Support levels: $120, $110, $100
LTC/USD – Daily Chart
The LTC/USD daily chart reveals the crypto-economic market operation rallies at $125 after a tinier downward moving force that led price to oscillate for about a fewer days around the trend line of the smaller SMA. The %0-day SMA indicator trends southward alongside the bearish trend line drew to position around the $150 resistance level above the 14-day SMA indicator. The Stochastic Oscillators have crossed southbound from the overbought region. And they now seemingly attempt crossing their lines back to the northbound as there is a bullish candlestick currently in the making.
Will the LTC/USD trade push northwardly past the $150 resistance level as the market rallies at $125?
The LTC/USD trade still has a better-promising outlook to push northwardly toward the $150 resistance level as the crypto market rallies at $125. The positioning of the 14-day SMA trading indicator around the formerly mentioned value-line suggests that support is located for the present rallying motion on a lighter note. But then, it still appears difficult to join the trend to the upside as there has been a very low-active motion.
On the downside of the technical analysis, the LTC/USD market short-position takers will have to exercise patience until the Stochastic Oscillators move into the overbought region to portend a situation of turning back southbound before deciding to go for a sell exertion order. Expectantly, the current rallying situation may revisit a resistance around the $150 in the long-term run if the US economy doesn’t lose more momentums abruptly based on the present trading capacity afterward.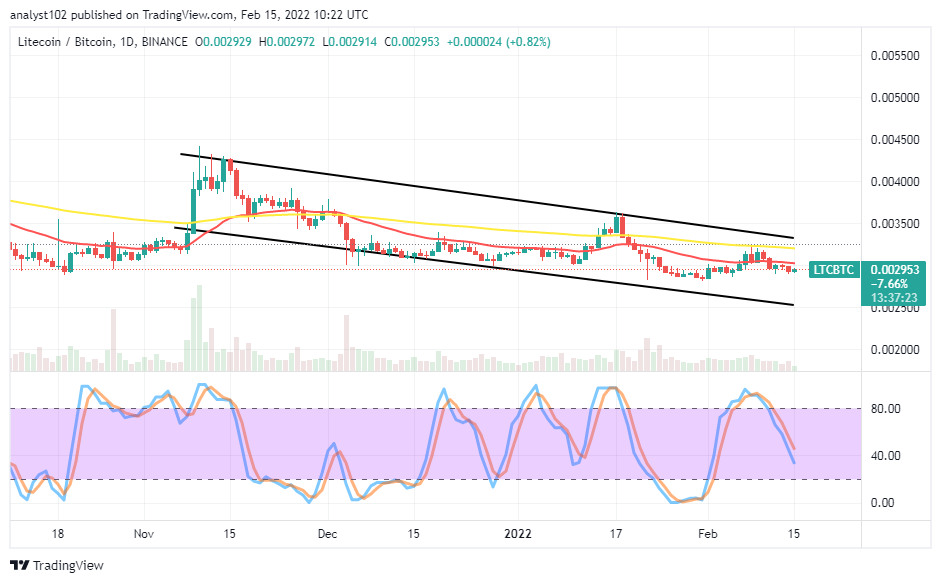
LTC/BTC Price Analysis
In comparison, Litecoin appears, yet, trading under a falling force as placed with Bitcoin. The cryptocurrency pair market operation moves tightly beneath the sell signal side of the smaller SMA. The 50-day SMA indicator is above the 14-day SMA indicator. Most of the activities have featured between the bearish channel trend lines drawn. The Stochastic Oscillators have crossed the lines southbound from the overbought region slightly against the range of 40. It appears that the base crypto may wallow under falling pressure for a while as the counter crypto still possesses a higher trending capacity tendency.
Note: Cryptosignals.org is not a financial advisor. Do your research before investing your funds in any financial asset or presented product or event. We are not responsible for your investing results.
You can purchase crypto coins here. Buy Tokens