Ethereum Is in a Downward Correction, Faces Rejection at $2,700
Estimated Reading Time: 2 minutes
Don’t invest unless you’re prepared to lose all the money you invest. This is a high-risk investment and you are unlikely to be protected if something goes wrong. Take 2 minutes to learn more

Free Crypto Signals Channel

Ethereum Price Long-Term Analysis: Bearish
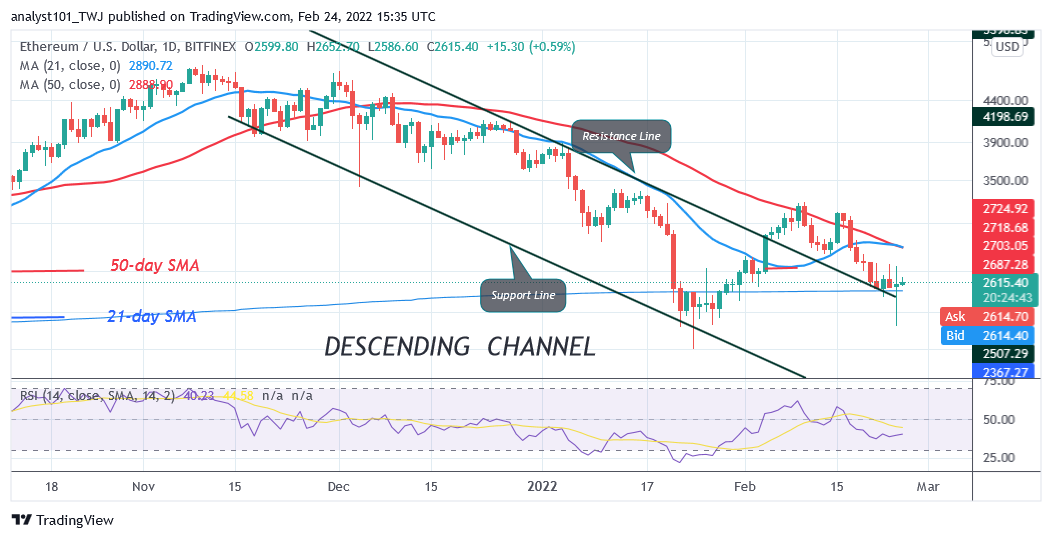
Ethereum’s (ETH) price is still in a downward correction as it faces rejection at $2,700. Ether price is fluctuating between $2,300 and $2,700 price levels. Yesterday, ETH price rebounded after falling to the low of $2,300 but the upward rally was also repelled at $2,700 high. The cryptocurrency is now consolidating above the $2,500 support. The price action is now characterized by small body indecisive candlesticks.
Ethereum Indicator Analysis
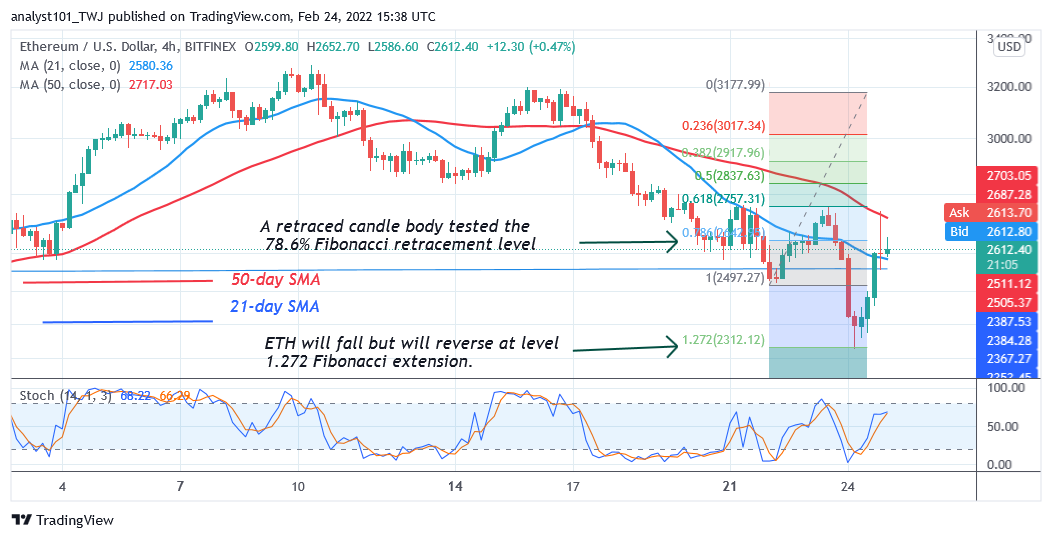
¬¬¬¬¬¬The altcoin is at level 40 of the Relative Strength Index for period 14. Ether is in the downtrend zone below the centerline 50. The largest cryptocurrency is capable of falling to the downside. The crypto’s price bars are below the moving averages which makes it prone to fall. Ether is above the 50% range of the daily stochastic. It indicates that the market has resumed bullish momentum.
Technical indicators:
Major Resistance Levels – $2, 600, $2,800, $3,000
Major Support Levels – $1.500, $1, 300, $1,100
What Is the Next Direction for Ethereum?
Ethereum has resumed bullish momentum after falling to the low of $2,306 but faces rejection at $2,700. The upward correction breaks above the 21-day SMA but was rejected at the 50-line SMA. Meanwhile, on February 22 downtrend; a retraced candle body tested the 78.6% Fibonacci retracement level. The retracement indicates that ETH will fall but will reverse at level 1.272 Fibonacci extension or $2,312.
You can crypto coins here.Buy LBlock
Note: Cryptosignals.org is not a financial advisor. Do your research before investing your funds in any financial asset or presented product or event. We are not responsible for your investing results