BNB Slides as It Approaches the $226.26 Low
Estimated Reading Time: 2 minutes
Don’t invest unless you’re prepared to lose all the money you invest. This is a high-risk investment and you are unlikely to be protected if something goes wrong. Take 2 minutes to learn more

BNB (BNB) Long-Term Analysis: Bearish
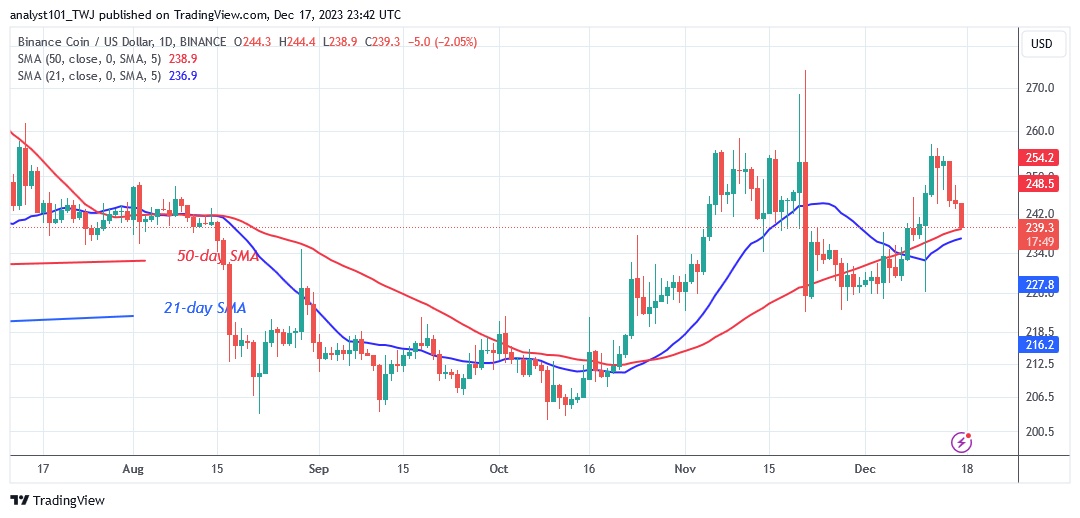
The BNB (BNB) price is falling as it approaches the $226.26 low. The bears are seeking to break below the 50-day simple moving average. BNB has dropped to a low of $239.10. The slide will continue until the low is above or below the moving average lines. In other words, the market will drop to $224. However, if the bulls halt the decline above the 50-day SMA, the market will resume its bullish ascent.
However, a sideways trend will restart if BNB/USD drops between the moving average lines. A few days could pass during a sideways trend.
Technical indicators:
Major Resistance Levels – $440, $460, $480
Major Support Levels – $240, $220, $200
BNB (BNB) Indicator Analysis
Given the bearish momentum, the price bars are expected to fall below the moving average lines. The crypto’s price has broken the upward-sloping moving average lines on the 4-hour chart. This points to the cryptocurrency’s continued collapse. Long candlestick tails may be seen at the bottom of the chart. The tail of these extended candlesticks signals significant buying by purchasers at lower price levels.
What Is the Next Direction for BNB (BNB)?
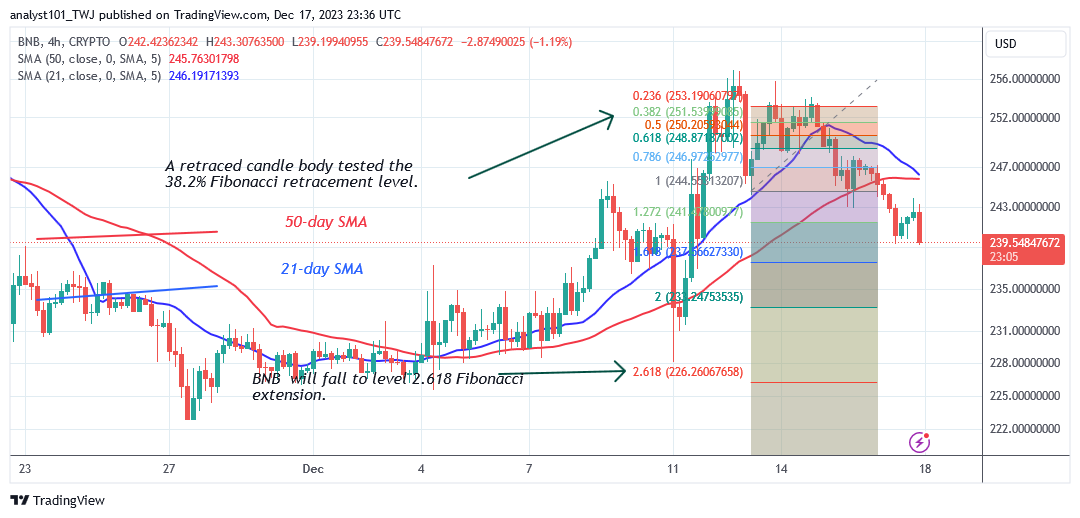
Binance Coin has slipped below the moving average lines on the 4-hour chart as it approaches the $226.26 low. The price indication predicts that the coin will continue to fall. BNB made an upward corrective after the December 13 drop, and a retraced candlestick body retested the 38.2% Fibonacci retracement line.
The correction predicts that the market will fall to the 2.618 Fibonacci extension, or $226.26.
You can purchase crypto coins here. Buy LBLOCK
Note: Cryptosignals.org is not a financial advisor. Do your research before investing your funds in any financial asset or presented product or event. We are not responsible for your investing results