BNB Backtracks Due to Substantial Selling at $260
Estimated Reading Time: 2 minutes
Don’t invest unless you’re prepared to lose all the money you invest. This is a high-risk investment and you are unlikely to be protected if something goes wrong. Take 2 minutes to learn more

BNB (BNB) Long-Term Analysis: Bullish
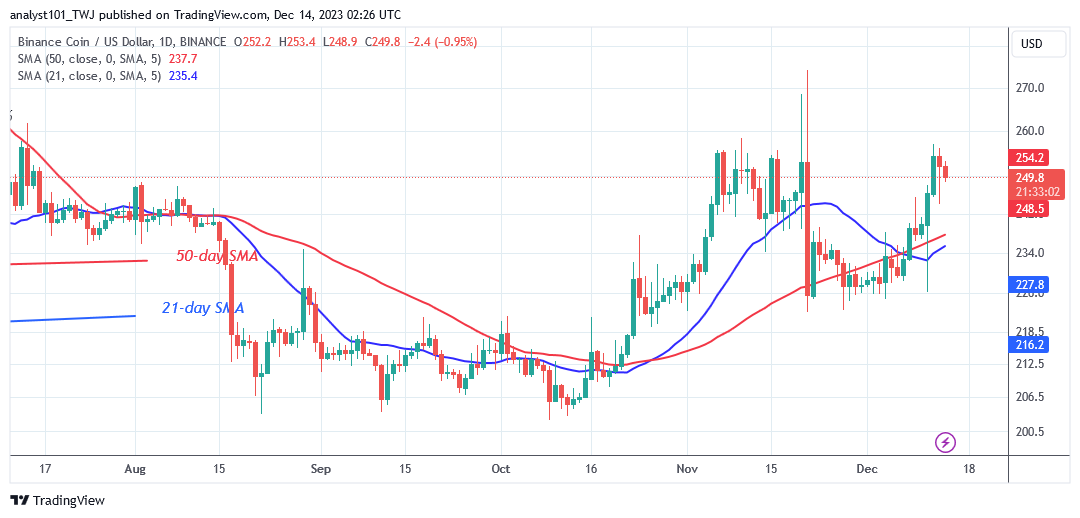
The BNB (BNB) price is moving sideways due to substantial selling at $260. BNB’s uptrend ended on November 6 when it reached a high of $255.70. Following that, the cryptocurrency’s price was rejected as it retested the $260 resistance level. The altcoin is currently trading above the 21-day SMA but below the $260 resistance level.
On the plus side, if the bulls break above the $260 level, the market will rise to a high of $282. BNB is currently plummeting after breaking through the resistance zone. The current sideways trend will continue if buyers are unable to keep the price above the $260 level. However, if the bears break below the moving average lines, BNB/USD will fall.
The altcoin will fall to a low of $220. Meanwhile, the altcoin is backtracking from the resistance zone.
Technical indicators:
Major Resistance Levels – $440, $460, $480
Major Support Levels – $240, $220, $200
BNB (BNB) Indicator Analysis
Price bars have returned above the moving average lines as a result of the recent price increase. The price of cryptocurrency will continue to increase to prior highs. The horizontal moving average lines are ascending.
What Is the Next Direction for BNB (BNB)?
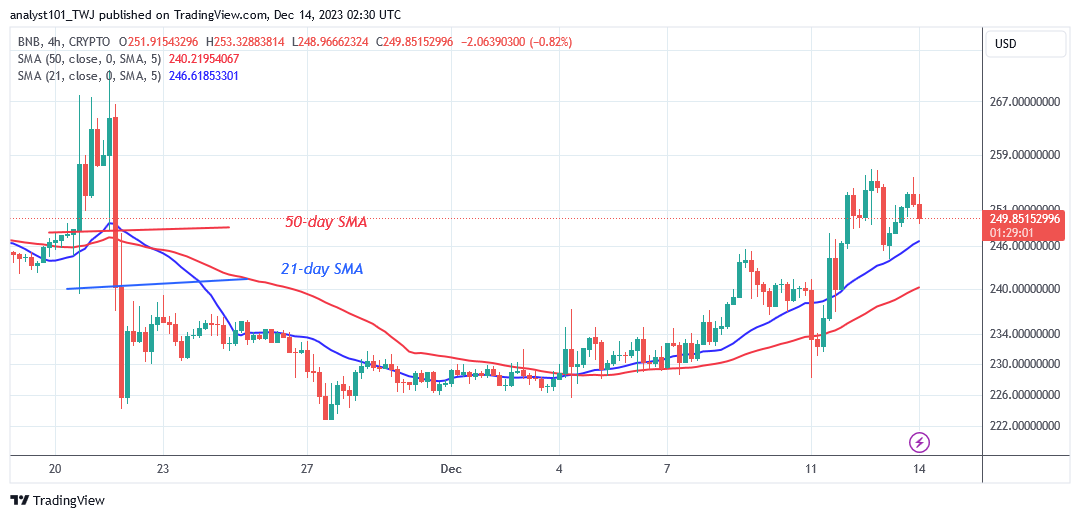
Binance Coin will continue to trade sideways due to substantial selling at $260. The bulls have not been able to breach above the $260 overhead barrier since July 14. The extended candlestick wicks on November 20 and 21 suggest significant selling pressure at higher price levels.
You can purchase crypto coins here. Buy LBLOCK
Note: Cryptosignals.org is not a financial advisor. Do your research before investing your funds in any financial asset or presented product or event. We are not responsible for your investing results