BNB Consolidates above $227 as It Resumes Its Horizontal Trend
Estimated Reading Time: 2 minutes
Don’t invest unless you’re prepared to lose all the money you invest. This is a high-risk investment and you are unlikely to be protected if something goes wrong. Take 2 minutes to learn more
BNB (BNB) Long-Term Analysis: Ranging
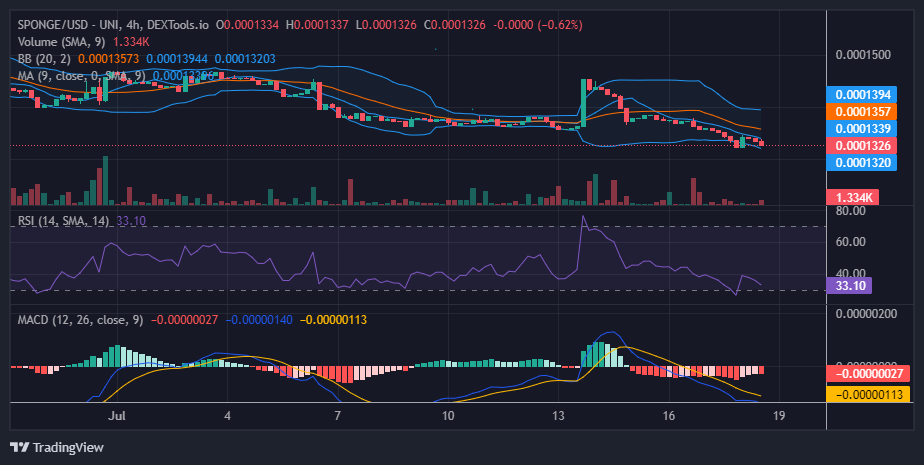
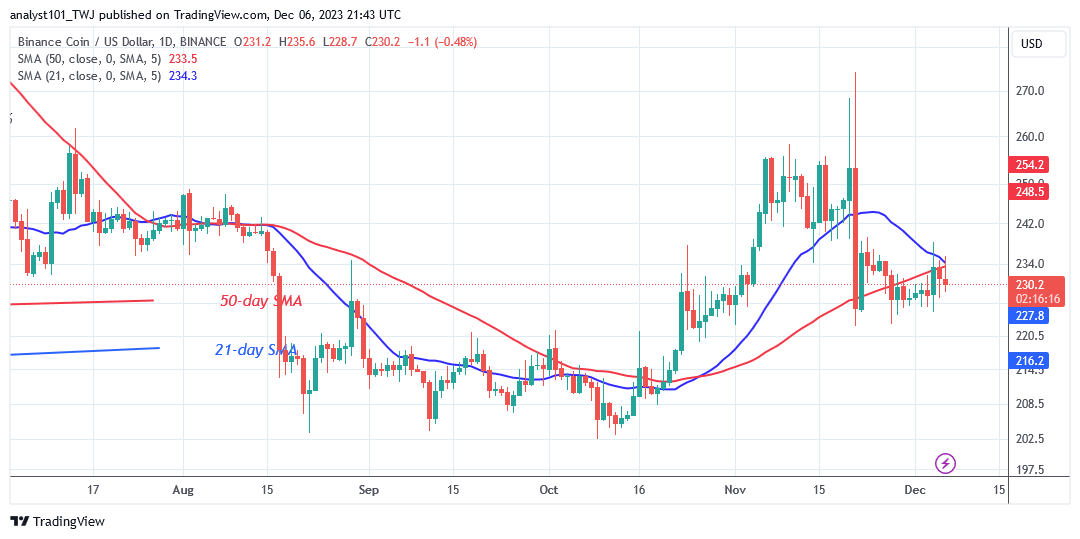
The BNB (BNB) price has been in its horizontal trend since the price decline on November 21. The crypto’s price has been restricted between $223 and $$235. At the time of writing, BNB is trading at $230.74. The cryptocurrency is now trading amid its price range. The price movement has been consistent due to the existence of Doji candlesticks.
The altcoin rebounded on December 4 but was stopped by the 50-day SMA. The crypto’s price has dropped below the moving average lines, giving the bears an advantage. The altcoin is likely to fall below its previous low because it is in a negative trend. BNB/USD will fall to its previous low of $203 if the current support level of $223 is surpassed.
The current upward movement is hampered by resistance at $235 and the 50-day SMA.
Technical indicators:
Major Resistance Levels – $440, $460, $480
Major Support Levels – $240, $220, $200
BNB (BNB) Indicator Analysis
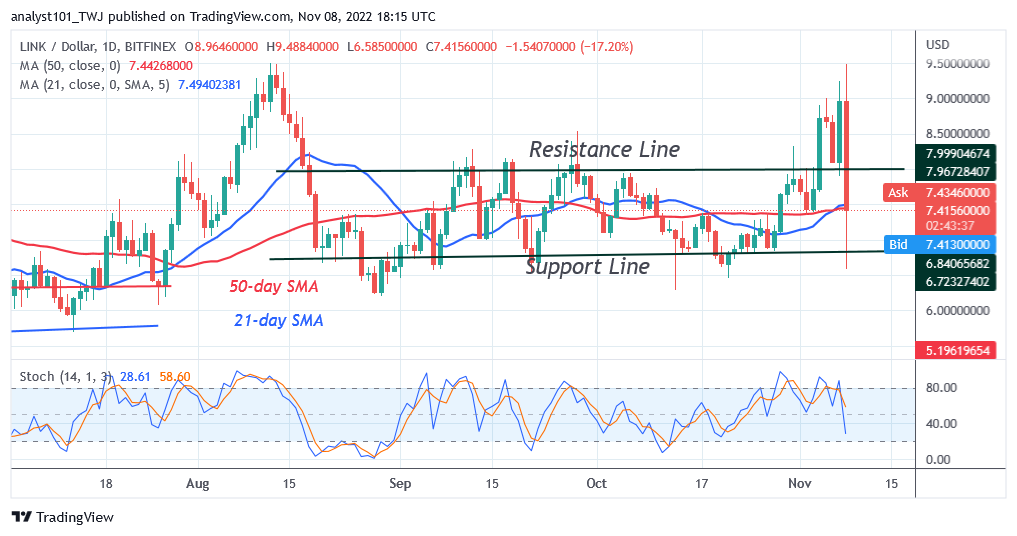
The price bars on the daily chart have remained stagnant below the horizontal moving average lines. Because of the sideways trend, the moving average lines have remained horizontal. The Doji candlesticks have maintained control over the price movement.
What Is the Next Direction for BNB (BNB)?
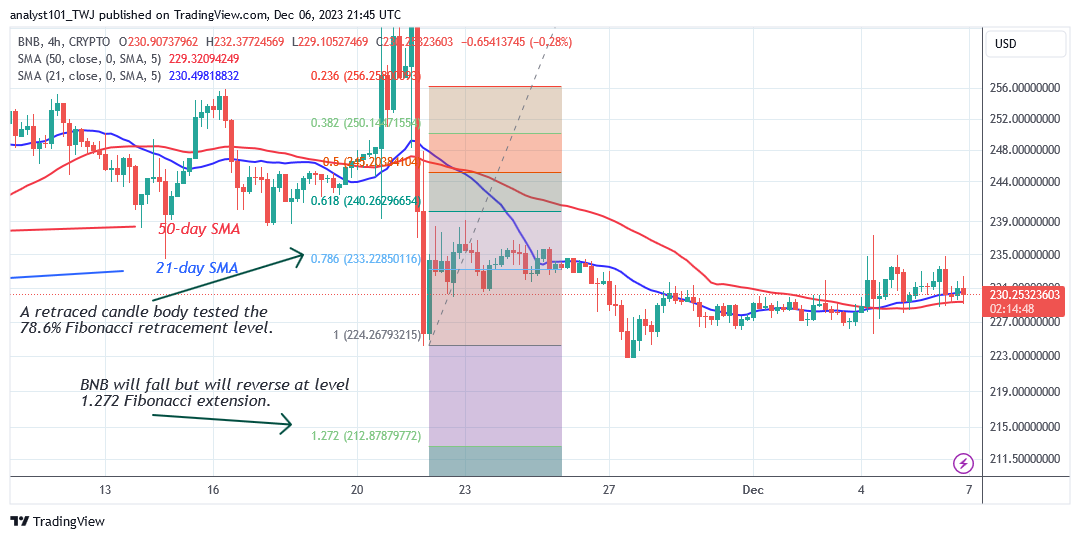
Binance Coin is consolidating above the $227 support level as it resumes its horizontal trend. The price movement has stagnated as a result of the development of Doji candlesticks. The altcoin is currently trading in the middle of a price range of $227 to $235. According to the price indication, BNB will fall to a low of $212.
You can purchase crypto coins here. Buy LBLOCK
Note: Cryptosignals.org is not a financial advisor. Do your research before investing your funds in any financial asset or presented product or event. We are not responsible for your investing results