Wall Street Memes (WSM) Trade Slows Down, Keeping Spikes
Estimated Reading Time: 3 minutes
Don’t invest unless you’re prepared to lose all the money you invest. This is a high-risk investment and you are unlikely to be protected if something goes wrong. Take 2 minutes to learn more
Wall Street Memes Price Prediction – March 30
Bargaining zones are being made to thrive in positivity around the trending postures of the indicators of the Bollinger Bands, as the financial crypto-economic outlook showcases that the WSM/USD trade slows down in actions, keeping spikes in its way of generating signal notes.
At present, the market is showing signs of regaining strong momentum, as candlesticks are forming a rebuilding pattern around the lower Bollinger Bands threshold. With this development emerging, WSM/USD sellers must exercise extreme caution when initiating new position orders.
WSM/USD Market
Key Levels
Resistance levels: $0.002, $0.0025, $0.003
Support levels: $0.0008, $0.0006, $0.0004
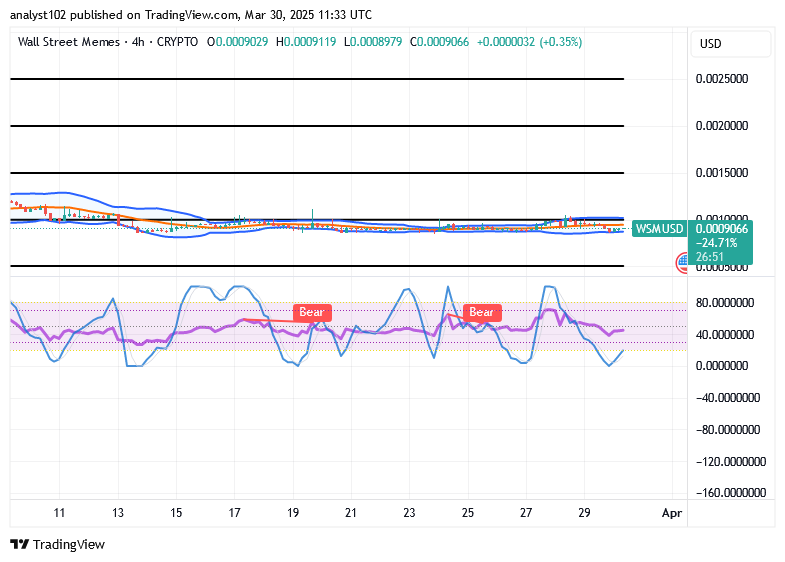
WSM/USD – 4-hour Chart
The WSM/USD medium-term chart showcases that the crypto-economic market slows down in price movements, keeping hikes.
The Bollinger Bands indicators continue to extend horizontally, with a slight adjustment creating a small gap on the downside. Meanwhile, the stochastic oscillators have moved south into the oversold region, suggesting a potential rebound to the upside.
Given the prevailing downward pressure on the WSM/USD market, is a further decline in its base value anticipated?
It has appeared that the WSM/USD market bulls have been firmly holding their base points tightly on the buy signal side of the lower Bollinger Band, as the trade reports that the price slows down, keeping hikes in its inputs.
Presently, it is now becoming more visible that long-term purchasers will have a conducive environment to identify optimal longing entries, as multiple touches have been concentrated at specific lower zones, allowing sellers to hold off and avoid being whipsawed in the process.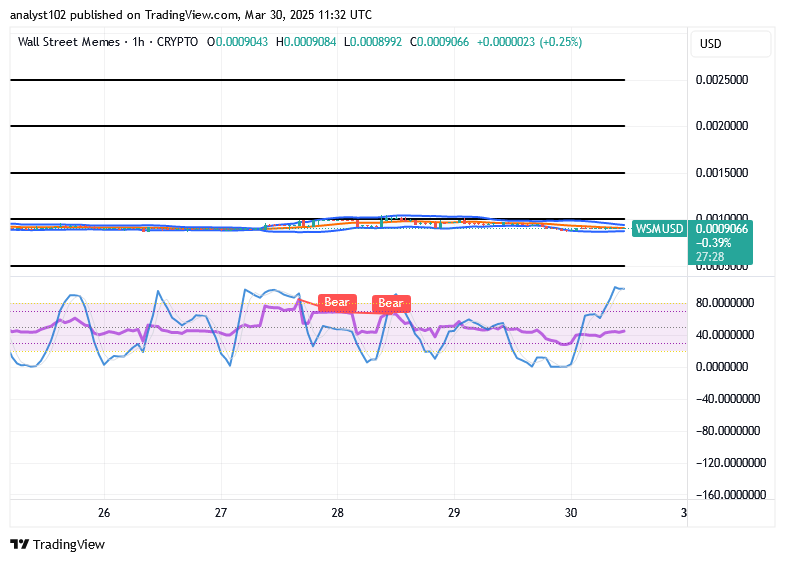
WSM/USD 1-hour chart
The WSM/USD 1-hour chart reveals that the short-term movement of the crypto-economic trade now slows down in active motions, keeping hikes in settings.
A horizontal line has been placed along the $0.001 trade level to highlight a key resistance point for the WSM/USD market. The Bollinger Bands indicators are positioned just below the trade line, confirming the market’s sideways movement. Meanwhile, the stochastic oscillators have moved north into the overbought region, indicating that buyers’ momentum has weakened at the time of writing.
Make Your Bet Right Now ➡️ https://wallstmemes.com/en/dashboard Visit https://wallstmemes.com to purchase now!
🔥 Up To 43% APY Now Available 🔥
— Wall Street Memes (@wallstmemes) October 8, 2023
(at the time of posting)
Stake Now ➡️ https://t.co/X031FQo0bW Buy Now ➡️ https://t.co/6zkwWf1VRF pic.twitter.com/o9qrY1zJn8