Wall Street Memes (WSM) Price Stagnates, Developing Hikes
Estimated Reading Time: 3 minutes
Don’t invest unless you’re prepared to lose all the money you invest. This is a high-risk investment and you are unlikely to be protected if something goes wrong. Take 2 minutes to learn more
Wall Street Memes Price Prediction – March 29
Overall trade signal inputs that have been generated over a couple of hours have now begun to showcase that capacity efforts on the part of bulls are being rendered relatively inactive, making the pricing system of the Wall Street Memes coin stagnate against the US dollar’s worth, developing hikes somewhat at the same time.
The key trading threshold remains centered around the $0.001 trade line, serving as the critical level for determining the market’s definitive directional bias amid upcoming volatility. That said, long-term investors should maintain confidence in a potential rebound, even if the pairing instruments experience a temporary devaluation from their current market valuation.
WSM/USD Market
Key Levels
Resistance levels: $0.002, $0.0025, $0.003
Support levels: $0.0008, $0.0006, $0.0004
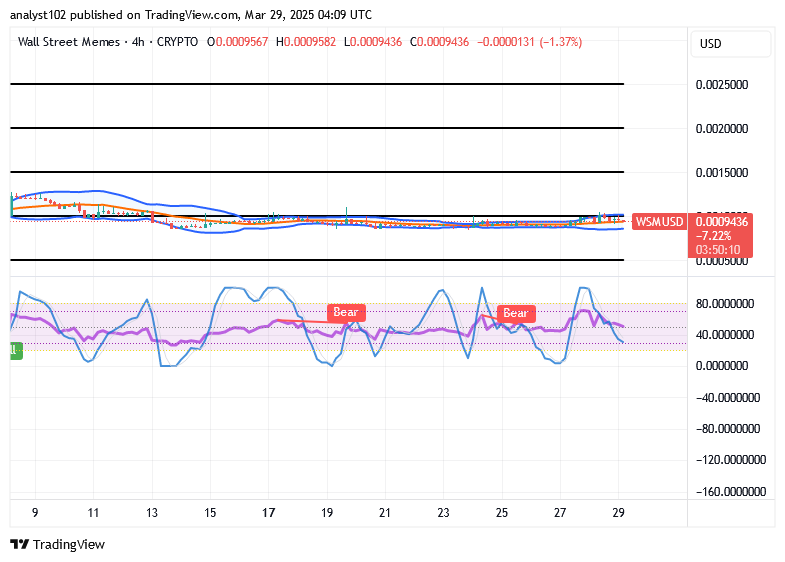
WSM/USD – 4-hour Chart
The WSM/USD medium-term chart reveals that the crypto-economic price stagnates in its posture, developing hikes in its signal settings.
The stochastic oscillator’s signaling system currently indicates that selling momentum is exerting downward pressure, counteracting any abrupt and hesitant attempts at bullish recovery. Simultaneously, the Bollinger Bands continue to extend laterally, reinforcing the $0.001 level as a key consolidation zone within the prevailing market structure.
From a technical perspective, is it justifiable to anticipate sustained selling pressure in the WSM/USD market, potentially driving prices lower and prompting the lower Bollinger Band to expand downward in response?
Already a series of price actions has surfaced, pushing the base instrument in its downward path believably in search for an all-time low value before reviving back for upside deals. As the situation is having it, it is not ideally logical for bears to prevail further in the forthcoming volatility indexes, given that the WSM/USD market stagnates its basis formation, developing hikes in the processes.
As of now, our trade outlook remains firmly in favor of accumulating additional long positions. A more in-depth technical assessment of the overall market structure suggests that the previously traded instrument requires further accumulation of momentum catalysts to reinforce its long-term bullish trajectory.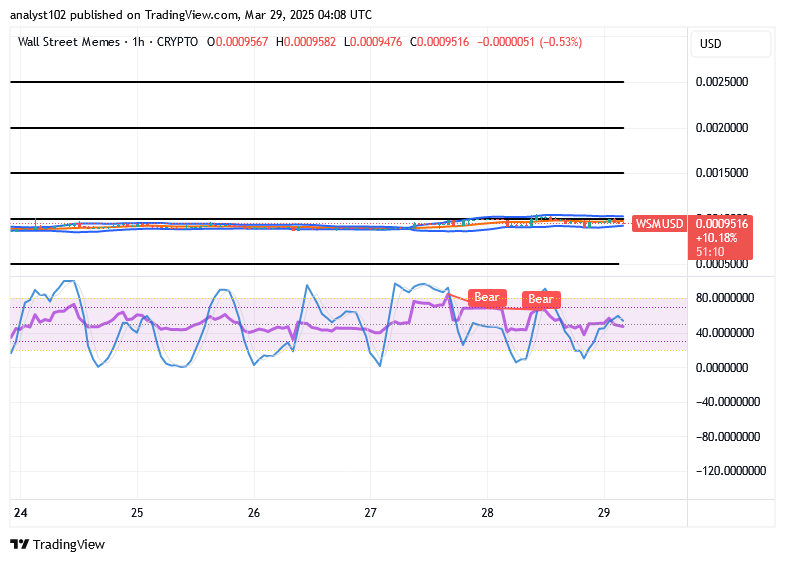
WSM/USD 1-hour chart
The WSM/USD 1-hour chart showcases that the short-term journey setting of the crypto-economic trade stagnates in its inputs, developing hikes in styles.
Various candlestick formations have emerged, indicating sluggish price action within the pairing market, contributing to a phase of minor indecision. This is further evidenced by the Bollinger Bands aligning in a lateral trajectory around the $0.001 level. Meanwhile, stochastic oscillators continue to fluctuate within a predominantly bearish framework, reflecting a lack of definitive momentum.
$WSM / $USDT is now available for trading on Bybit Perpetuals.
$WSM community, we saw your Tweets! 👏$WSM / $USDT is now tradeable on #Bybit Perpetuals.
— Bybit (@Bybit_Official) October 13, 2023
Trade here: https://t.co/le4XyVyXaZ
Also want your project listed? Share your suggestions here:https://t.co/W7EWJVVNV5 https://t.co/XgXoL7g0rF