Polkadot Makes a False Breakout, Resumes Downward Correction
Estimated Reading Time: 2 minutes
Don’t invest unless you’re prepared to lose all the money you invest. This is a high-risk investment and you are unlikely to be protected if something goes wrong. Take 2 minutes to learn more

Free Crypto Signals Channel

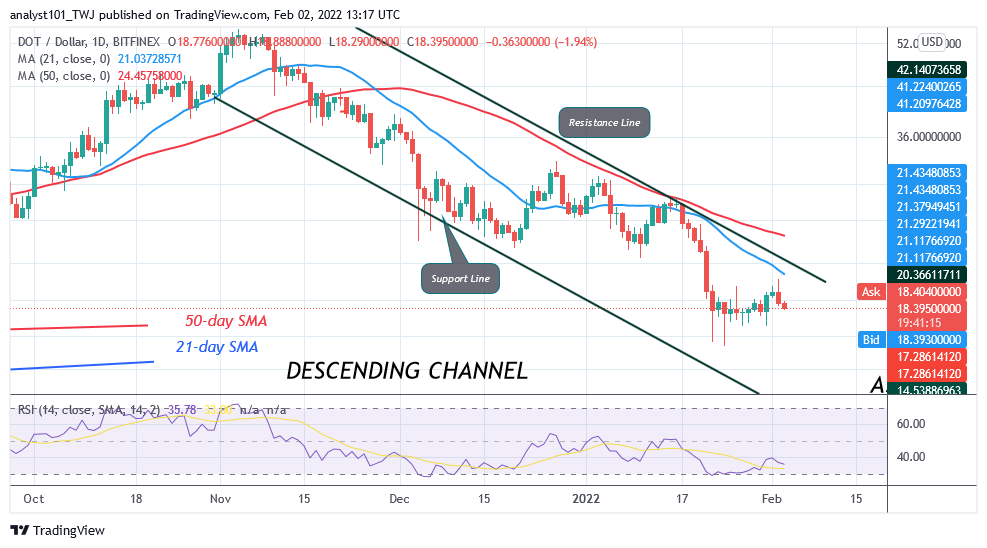
Polkadot (DOT) Long-Term Analysis: Bearish
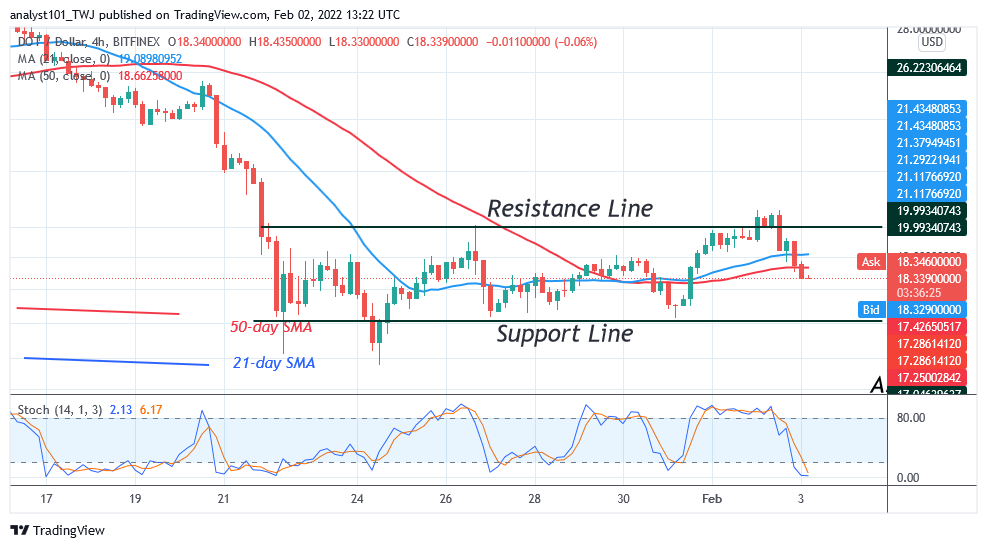
Since January 22, Polkadot’s (DOT) price has been fluctuating between $17 and $20 price levels as it resumes downward correction. The previous downtrend has ended as price fell to the low of $15. On February 2, the bulls broke above the resistance line of the horizontal channel but failed to sustain the bullish momentum. The crypto’s price has fallen back to the range-bound zone. On the upside, if the bulls had broken above the resistance at $20, the market would have rallied to $30. Today, DOT price is falling to the downside. It may retest the lower price range at $17. However, if the bears break below the $17 support, the DOT price will decline to the low of $14.
Polkadot (DOT) Indicator Analysis
The crypto’s price is at level 35 of the Relative Strength Index for period 14. The market is still in the downtrend zone below the centerline 50. DOT price bars are below the moving averages indicating a possible fall of the crypto. DOT price is below the 20% range of the daily stochastic. Polkadot is trading in the oversold region. Buyers are expected to push prices upward.
Technical indicators:
Major Resistance Levels – $48, $52, $56
Major Support Levels – $32, $28, $24
What Is the Next Direction for Polkadot (DOT)?
The cryptocurrency is still at the bottom of the chart as it resumes downward cccccorrection. The altcoin is fluctuating between the $17 and $20 price levels. Yesterday, the altcoin had a false breakout which has caused it to decline sharply to the lower price range. The uptrend will resume if price breaks above the resistance line of the horizontal channel and the bullish momentum is sustained.
You can purchase crypto coins here. Buy Tokens
Note: Cryptosignals.org is not 1a financial advisor. Do your research before investing your funds in any financial asset or presented product or event. We are not responsible for your investing results