Polkadot Declines to $15.83 Low, Risks Further Selling below Support
Estimated Reading Time: 2 minutes
Don’t invest unless you’re prepared to lose all the money you invest. This is a high-risk investment and you are unlikely to be protected if something goes wrong. Take 2 minutes to learn more
Polkadot (DOT) Long-Term Analysis: Bearish
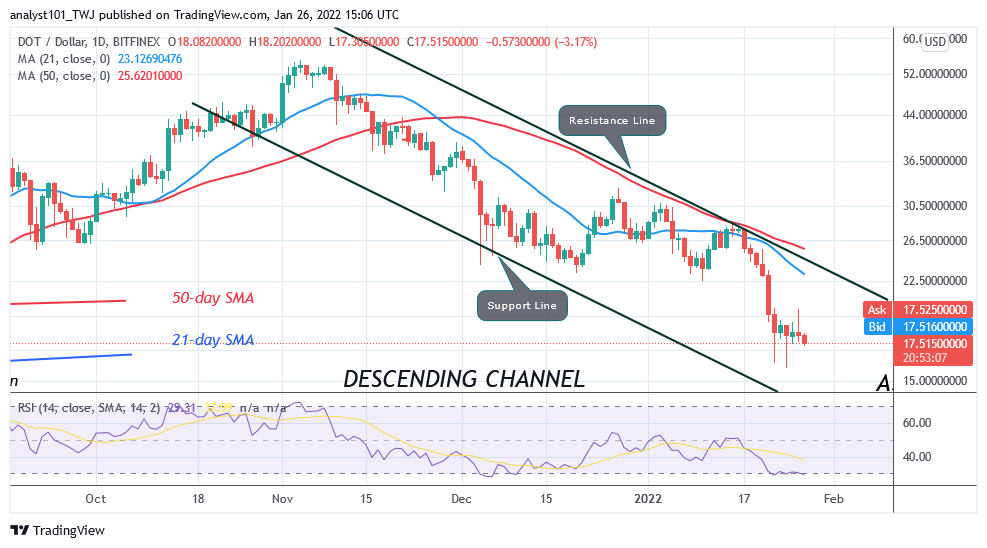
Polkadot’s (DOT) price fall has reached bearish exhaustion but risks further selling below support. The downtrend has reached the low of $17.52 as of press time. On January 22, Polkadot plunged to $16.10 and commenced a range-bound movement. DOT/USD has been fluctuating between $15.50 and $19.50 price levels. The price action is now dominated by small indecisive candlesticks called Doji and Spinning tops. These candlesticks describe indecision between buyers and sellers. Meanwhile, the downward price movement is insignificant as the market reaches the oversold region.
Polkadot (DOT) Indicator Analysis
DOT price is at level 29 of the Relative Strength Index for period 14. The market has declined to the oversold region. The downtrend is likely to end. DOT price bars are below the moving averages indicating a possible fall of the crypto. DOT price is below the 20% range of the daily stochastic. The altcoin is trading in the oversold region.
Technical indicators:
Major Resistance Levels – $48, $52, $56
Major Support Levels – $32, $28, $24
What Is the Next Direction for Polkadot (DOT)?
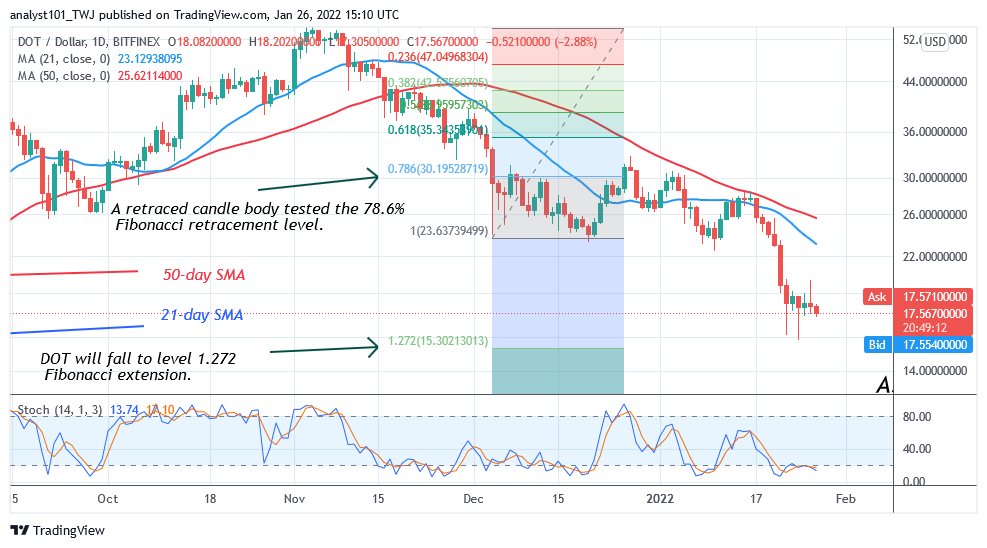
Following the January 22 price slump, the downtrend has subsided but risks further selling below support. Meanwhile, on December 4 downtrend, a retraced candle body tested the 78.6% Fibonacci retracement level. The retracement indicates that DOT price will fall but reverse at level 1.272 Fibonacci extension or $15.30.
You can purchase crypto coins here. Buy Tokens
Note: Cryptosignals.org is not a financial advisor. Do your research before investing your funds in any financial asset or presented product or event. We are not responsible for your investing results