Binance Coin Consolidates Above $500 Support, May Resume Upward
Estimated Reading Time: 2 minutes
Don’t invest unless you’re prepared to lose all the money you invest. This is a high-risk investment and you are unlikely to be protected if something goes wrong. Take 2 minutes to learn more
Binance Coin (BNB) Long-Term Analysis: Bearish
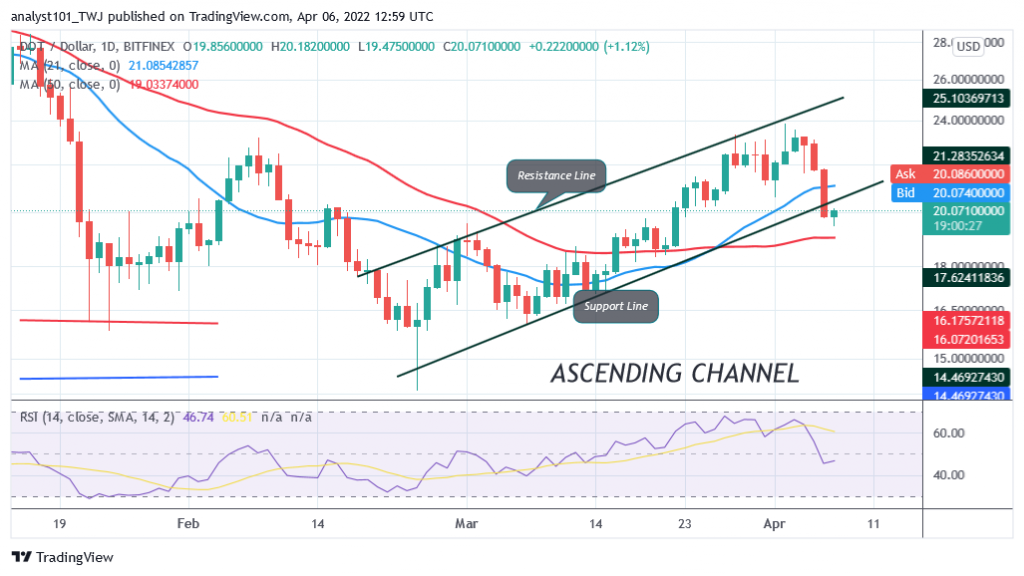
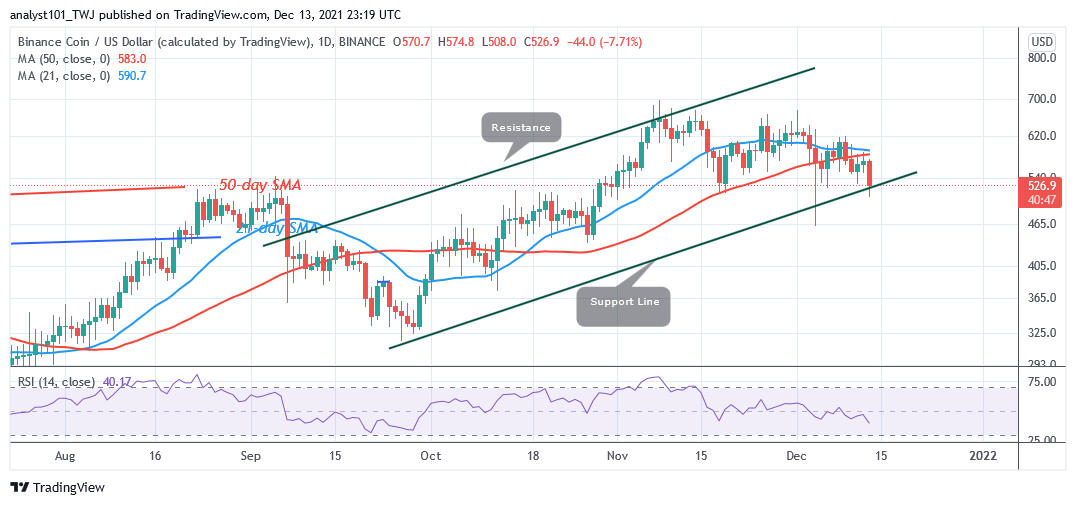
Binance Coin’s (BNB) price is in a downward move as price breaks below the moving averages. As price breaks below the moving averages, there is a tendency for a further downward movement of the altcoin. On December 4 price breakdown, BNB plunged to $461 but the bulls bought the dips. BNB price corrected upward to $616 but was repelled. Today, BNB has fallen to $508 which is the historical price level of November 18. Nevertheless, if price breaks below the current support, BNB will further decline to $436 or $461. Conversely, a rebound above the current support will catapult the altcoin to the high of $640.
Binance Coin (BNB) Indicator Analysis
BNB has fallen to level 39 of the Relative Strength Index for period 14. It indicates that the cryptocurrency is still in the downtrend zone and below the centerline 50. It also means that BNB is capable of further decline. The crypto’s price is below the moving averages which is the major determinant of the downward move. BNB has fallen below the 20% range of the daily stochastic. The crypto is now in the oversold region of the market. It implies that the current downtrend is likely to end.
Technical indicators:
Major Resistance Levels – $640, $660, $680
Major Support Levels – $540, $520, $500
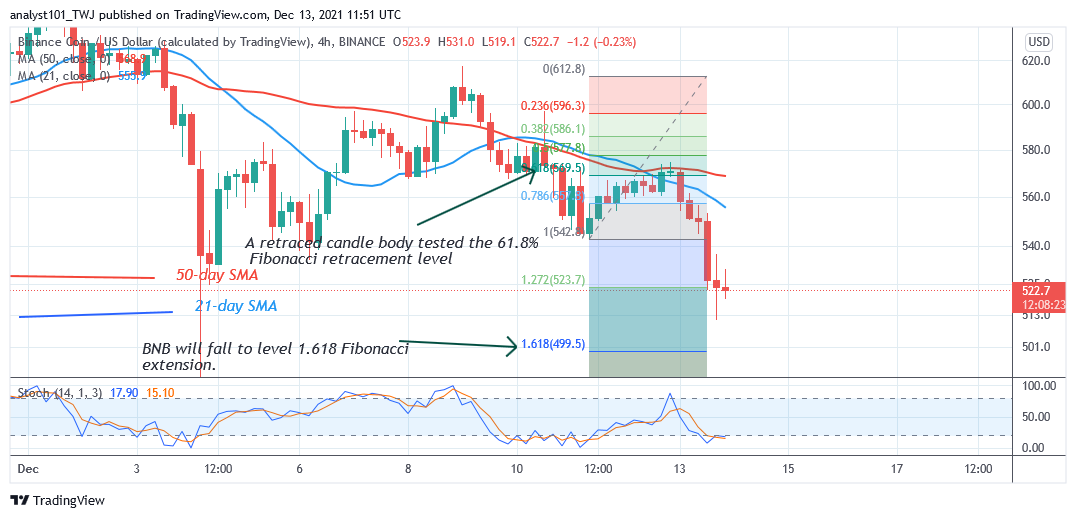
What Is the Next Direction for Binance Coin (BNB)?
On the 4 –hour chart, BNB/USD is in a downward move. The downward movement is propelled by the rejections at $620 and $580. Meanwhile, on December 11 downtrend; a retraced candle body tested the 61.8% Fibonacci retracement level. The retracement indicates that Binance Coin will fall to level 1.618 Fibonacci extension or $499.50
You can purchase crypto coins here. Buy Tokens
Note: Cryptosignals.org is not a financial advisor. Do your research before investing your funds in any financial asset or presented product or event. We are not responsible for your investing results