OFFICIAL TRUMP (TRUMP/USD) Finds Stability Around $40 Amid Market Volatility
Estimated Reading Time: 3 minutes
Don’t invest unless you’re prepared to lose all the money you invest. This is a high-risk investment and you are unlikely to be protected if something goes wrong. Take 2 minutes to learn more
The OFFICIAL TRUMP market, after surging to a peak of $80, has now settled around the $40 price level. Bulls are rallying at this level, taking long positions in an attempt to drive a significant market rally. Currently, price action appears to be flattening as demand and supply reach a standoff at this level.
The market has found a comfortable higher price point. Before the initial surge, the price stood at $4. Now, the $40 level appears to serve as a strong base, potentially setting the stage for further upward momentum.
The OFFICIAL TRUMP Market Data
- TRUMP/USD Price Now: $38.26
- TRUMP/USD Market Cap: $ 7.8 billion
- TRUMP/USD Circulating Supply: 200 million TRUMP
- TRUMP/USD Total Supply: 999.99 TRUMP
- TRUMP/USD CoinMarketCap Ranking: #24
Key Levels
- Resistance: $40, $50, and $80
- Support: $30, $25, and 20.
The OFFICIAL TRUMP Market Through the Lens of Indicators
The OFFICIAL TRUMP market has been making notable waves in the cryptocurrency space. Recently, the market experienced a dramatic surge, with the price peaking at $80. This rally has attracted significant attention from investors, prompting some to enter the market while others take profits from the recent high.
Currently, bullish and bearish sentiments are clashing around the $40 price level, with the crypto signal appearing to be in equilibrium for now. However, observing the chart reveals that the bulls’ position at $40 is under considerable pressure, causing the price to dip slightly below this level.
Despite this, a key support level exists around $32, which could stabilize the OFFICIAL TRUMP market if the bulls lose their grip at $40. Should the price fail to hold this support, the market could be primed for a significant downturn.
As a politically themed market, often linked to memecoins, it remains highly speculative and volatile. Further analysis of indicator trends will provide clearer insights into the market’s next potential move.
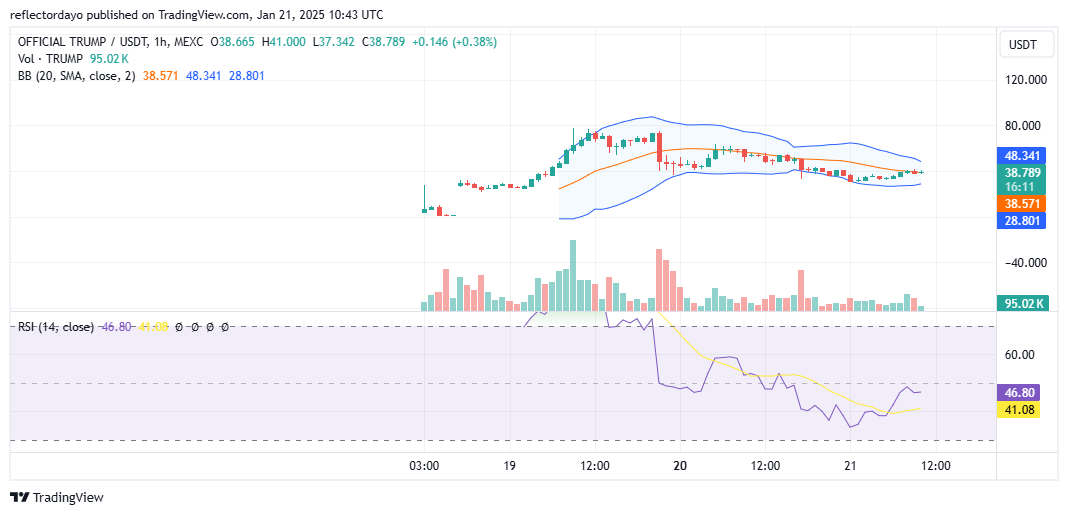
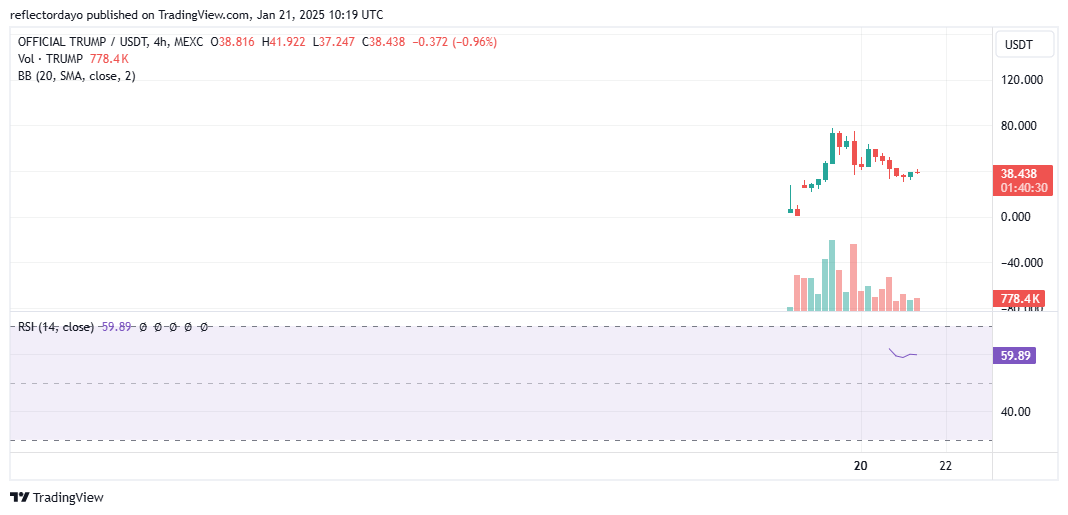
TRUMP/USD Price Prediction: 4-Hour Chart Analysis
Zooming in on the 1-hour chart, the interaction between buyers and sellers at this level confirms that bullish traders maintain a strong interest in the price range. This is evidenced by the progressively smaller candlesticks, indicating a decline in volatility as the standoff between demand and supply continues.
However, the bears appear to be gaining an edge in the market. This is reflected in the gradual and consistent descent of the lows. From this perspective, the support level has shifted downwards from $40 to approximately $31. Although the price has shown a quick upward recovery, bearish sentiment still subtly influences this level.
With declining volatility, breaking through the resistance appears challenging, as traders remain cautious. A minor fundamental catalyst could, however, reignite market momentum and provide the strength needed for a significant move.