The Aave Market (AAVE/USD) Gains Traction as Upward Momentum Builds
Estimated Reading Time: 4 minutes
Don’t invest unless you’re prepared to lose all the money you invest. This is a high-risk investment and you are unlikely to be protected if something goes wrong. Take 2 minutes to learn more
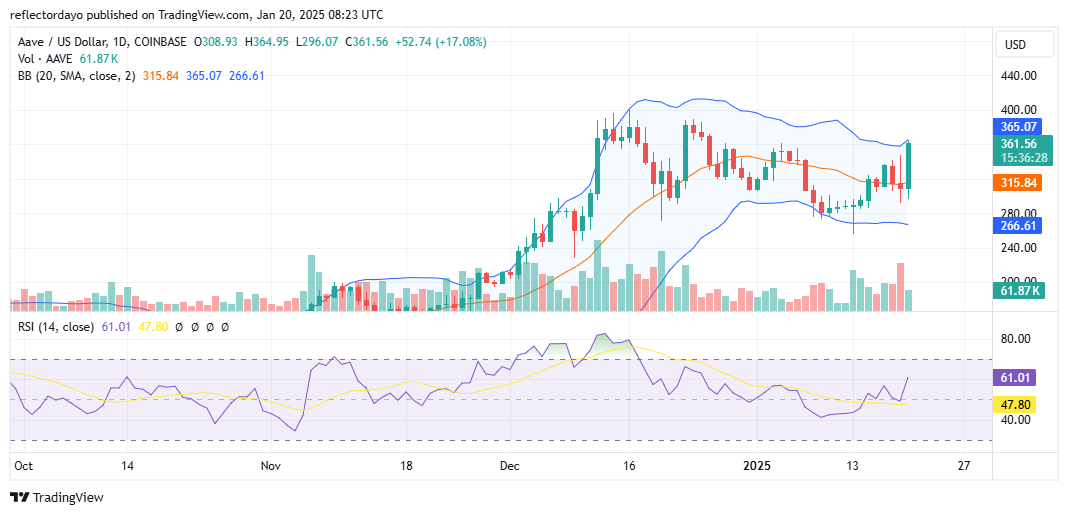
The Aave (AAVE/USD) market has begun showing signs of upward momentum. Previously, the market experienced a bearish trend, characterized by descending peaks since the last bullish rally in December. During that rally, the price reached a peak of approximately $400. However, following this peak, the market saw progressively lower highs.
One notable level of interest for bullish traders is the $280 price point. This level served as a resistance during the December rally and later emerged as a critical support level during the subsequent bearish phase. It is from this support level that the current upward trend has started to materialize.
A key signal of the crypto market‘s bullish shift is the price breaking above the last lower resistance level at $335. This breakout signifies a potential trend reversal, marking the emergence of renewed buying interest and indicating a significant change in market sentiment.
The Aave Market Data
- AAVE/USD Price Now: $361
- AAVE/USD Market Cap: $ 5.4 billion
- AAVE/USD Circulating Supply: 15 million AAVE
- AAVE/USD Total Supply: 16 million AAVE
- AAVE/USD CoinMarketCap Ranking: #31
Key Levels
- Resistance: $400, $450, and $500
- Support: $335, $320, and 280.
The Aave Market Through the Lens of Indicators
After breaking the key resistance level at $335, which marked the upper limit of the previous bearish market, the Aave (AAVE/USD) market has signaled a shift in favor of the bulls. This significant price movement has encouraged more bullish traders to enter long positions, driving the market upward. As a result, the price quickly surged to the $360 threshold, even briefly surpassing it.
At this level, bearish sentiment may re-emerge, potentially leading to a price correction. However, given the strong bullish momentum that has characterized the market thus far, heightened volatility is likely, with rapid price fluctuations between buyers and sellers. Should the correction push the price below $360, the former resistance level at $335 could act as a support zone, as bullish traders have consolidated their position around this level. A rebound from this point remains a strong possibility.
From a technical perspective, indicators suggest there is still room for further bullish movement. The RSI currently measures momentum at 59, indicating that the market is not yet overbought. Additionally, the price action remains within the Bollinger Bands envelope, signaling stability and the potential for continued upward movement. These readings may attract further bullish sentiment among traders and analysts.
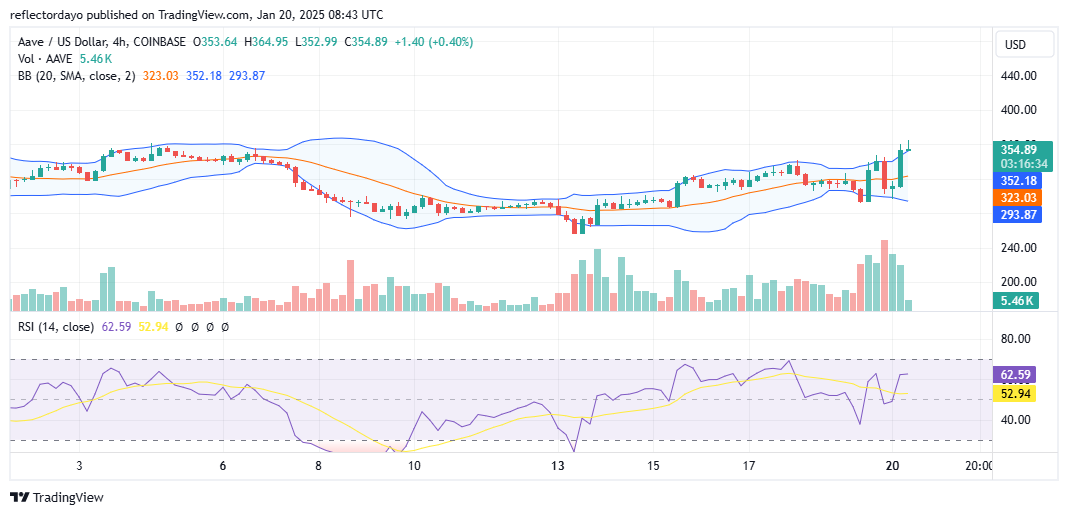
AAVE/USD Price Prediction: 4-Hour Chart Analysis
After the Aave market price briefly peaked at $365, bearish sentiment at this level, combined with profit-taking, triggered a market correction. Bears capitalized on the heightened volatility driven by the bullish rally to push the price lower. However, the correction has been limited, with the price currently holding near the $360 level. This indicates that bullish sentiment still outweighs bearish pressure at this point.
If the market can decisively break above the $360 level, it could attract further bullish momentum, potentially driving the price toward the critical $400 level. This $400 price point marks the peak reached during the rally in early December last year and remains a significant psychological and technical resistance level for traders.