Dogecoin (DOGE/USD) Breaks Through $0.40 Resistance with Bullish Momentum
Estimated Reading Time: 3 minutes
Don’t invest unless you’re prepared to lose all the money you invest. This is a high-risk investment and you are unlikely to be protected if something goes wrong. Take 2 minutes to learn more
In today’s Dogecoin trading session, the market is experiencing a significant bullish surge, breaking through a resistance level that has held since December 18. This breakout has the potential to attract increased bullish sentiment, suggesting that the market may be poised for further upward momentum. However, it’s important to note that some traders are engaging in early profit-taking, as evidenced by the small upper shadow on the bullish candlestick.
Dogecoin Market Data
- DOGE/USD Price Now: $0.419
- DOGE/USD Market Cap: $ 61 billion
- DOGE/USD Circulating Supply: 147.6 billion
- DOGE/USD Total Supply: 147.65 billion
- DOGE/USD CoinMarketCap Ranking: #7
Key Levels
- Resistance: $0.45, $0.50, and $0.55
- Support: $0.35, $0.30, and $0.25.
The Dogecoin Market Through the Lens of Indicators
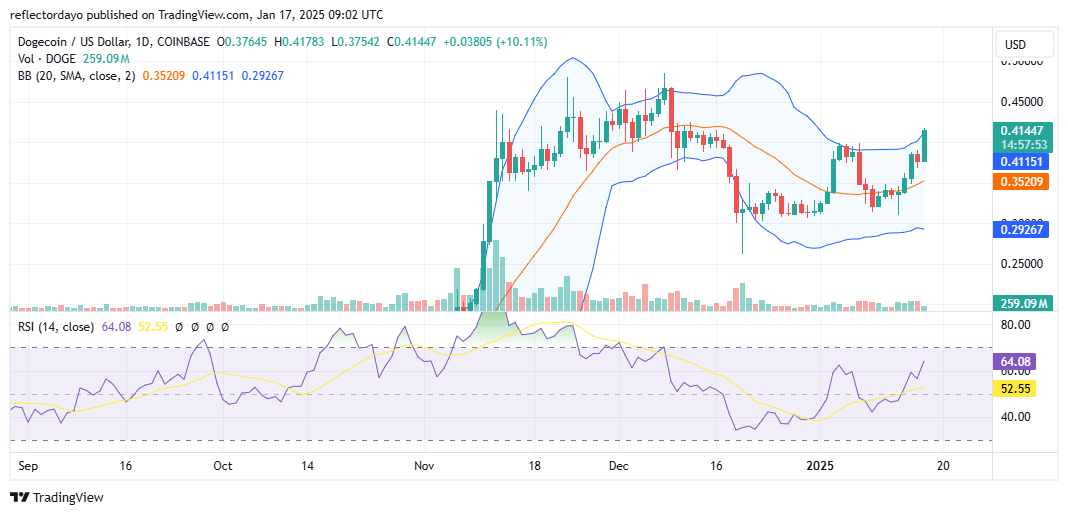
The $0.40 price level has previously served as a key support level between late November and early December. During that period, a surge above this level triggered significant market volatility. Bullish and bearish biases clashed around this level until late in the trend, when bearish traders gained control, causing the price to drop to the $0.30 level. At that time, the $0.45 to $0.50 range acted as a resistance zone, representing strong bearish sentiment and a key selling area for Dogecoin traders.
Currently, the selling pressure from this resistance zone appears to be extending downward, with minimal selling already taking place. Despite this crypto signal, bullish traders are demonstrating resilience. If they maintain this momentum, they could drive a recovery and push the Dogecoin market toward higher price levels. Given today’s strong bullish performance, the price is likely to hold above the $0.40 level. This robust upward movement has likely reinforced bullish strength around the $0.40 support zone.
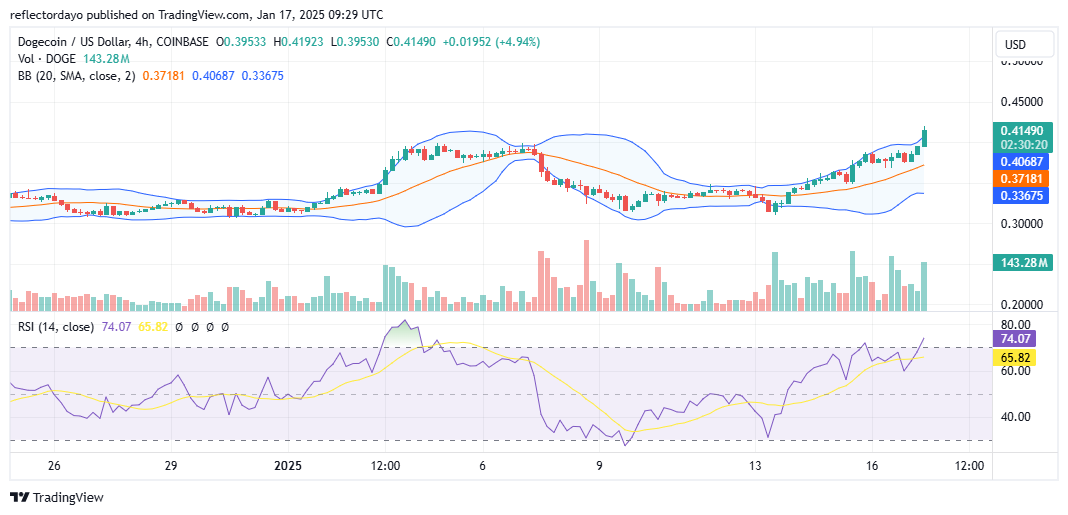
DOGE/USD Price Prediction: 4-Hour Chart Analysis
The 4-hour chart highlights the progressiveness of the bull market, with higher lows and higher highs becoming increasingly consistent. This bullish momentum appears likely to continue, as evidenced by the trade volume indicator. The histogram shows significant activity, confirming the strength of the ongoing bullish candlestick in the current trading session.
However, a closer comparison of the bullish candlestick and the histogram suggests a growing contention between demand and supply, which may be limiting the market’s ability to reach new price highs. Additionally, while the RSI is starting to indicate overbought conditions, this does not necessarily signal an imminent correction. The persistent bullish sentiment may keep prices lingering in the overbought territory for an extended period.
Traders should also consider that volatility is rising on the 4-hour chart due to increased resistance from bearish forces in these new price zones. This suggests that caution is warranted, as the market navigates a delicate balance between bullish momentum and bearish pressure.