Litecoin (LTC/USD) Surges to $116 but Faces Resistance Above Key Level
Estimated Reading Time: 3 minutes
Don’t invest unless you’re prepared to lose all the money you invest. This is a high-risk investment and you are unlikely to be protected if something goes wrong. Take 2 minutes to learn more

Following an impressive Litecoin bull run between November and December, which propelled the price to the $140 level, a subsequent bearish correction brought the price down to stabilize around the $100 level in the latter half of December. Since then, the $100 level has held firm as a critical support, acting as a stronghold for the bulls to counter bearish advances. However, the market has consistently struggled to break above the $116 resistance level.
In the most recent trading session, a candlestick pattern indicated strong bullish activity, signaling a surge in buying interest. This upward movement may be influenced by fundamental factors, potentially tied to growing speculation about the approval of a Litecoin ETF in the United States. Such developments could be fueling the renewed optimism and market momentum observed in the last trading session.
Litecoin Market Data
- LTC/USD Price Now: $118
- LTC/USD Market Cap: $8.95 billion
- LTC/USD Circulating Supply: 75.4 million
- LTC/USD Total Supply: 84 million
- LTC/USD CoinMarketCap Ranking: #20

Key Levels
- Resistance: $120, $125, and $130.
- Support: $100, $85, and $80.
Litecoin Market Analysis: The Indicators’ Point of View
Following the significant buying activity in the previous trading session, the market is now struggling to sustain levels above the recently reclaimed $116 mark. The appearance of a candlestick with a small body and moderate upper and lower shadows indicates a balance between buying and selling pressures. This formation suggests that the bulls are facing challenges in maintaining their position at this new high, signaling the possibility of a correction in the crypto market.
However, if the Litecoin bulls can hold their ground, the market may consolidate above $116. This would require sustained bullish momentum to counteract the selling pressure from traders exiting their long positions to secure profits. Such consolidation could serve as a base for potential upward movement if bullish sentiment persists.
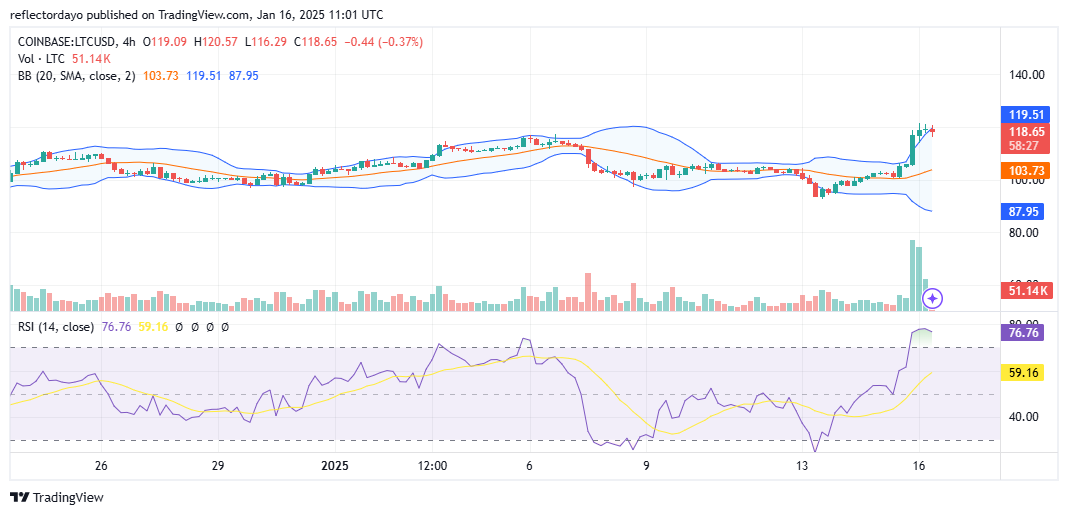
LTC/USD 4-Hour Chart Outlook
Examining the 4-hour chart, the $120 price level emerges as a key level likely to attract a conflict of market biases. As indicated by the volume indicators, following yesterday’s strong buying activity, which was accompanied by a notable histogram, the subsequent histograms—although showing a decrease in height—suggest a tug-of-war between buyers and sellers. This is expected, as the Relative Strength Index (RSI) has already indicated that the market is in an overbought condition, contributing to a bearish sentiment among some traders.
Despite this, the Litecoin market may still have the potential to surge higher following a correction of the RSI. Any continued upward movement could be further supported by fundamental factors driving the market.