Ethereum (ETH) May Resume Selling Pressure, Faces Rejection at Level $3,000
Estimated Reading Time: 2 minutes
Don’t invest unless you’re prepared to lose all the money you invest. This is a high-risk investment and you are unlikely to be protected if something goes wrong. Take 2 minutes to learn more

Ethereum Price Long-Term Analysis: Bullish
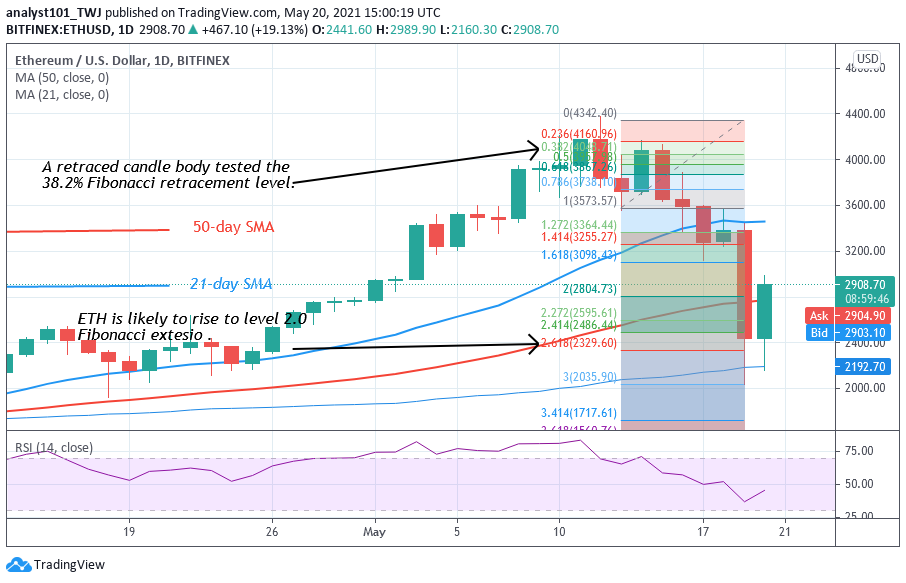
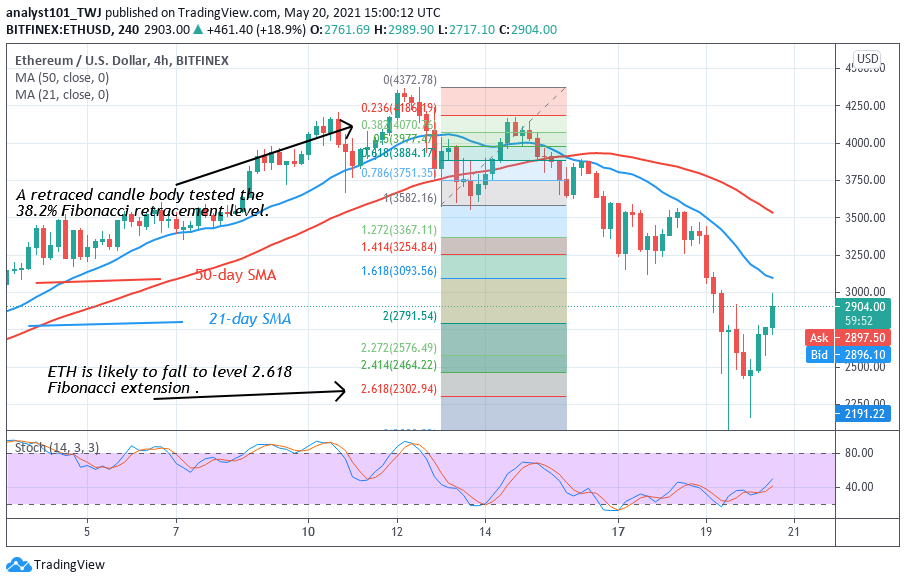
Ethereum has resumed an upward move after falling to the low of $2,160.30. If the current support holds, it will signal the resumption of the uptrend. The uptrend proper will commence when buyers pushed the altcoin above $3,600 support. However, if buyers face resistance at $3,600 high, the selling pressure will resume. Meanwhile, on May 13 downtrend; a retraced candle body tested the 38.2% Fibonacci retracement level. The retracement indicates that the market will fall to level 2.618 Fibonacci extensions or level $2302.94. From the price action Ether fell to the low at $2033.70. The biggest altcoin has resumed upward move.
Ethereum Indicator Analysis
Ethereum is at level 45 of the Relative Strength Index period 14. It implies that Ether price is in the bearish trend zone and below the centerline 50. The 21-day and 50-day SMAs are sloping upward indicating the uptrend. Ether is above the 40% range of the daily stochastic. It indicates that it is in a bullish momentum.
Technical indicators:
Major Resistance Levels – $2, 600, $2,800, $3,000
Major Support Levels – $1.500, $1, 300, $1,100
What Is the Next Direction for Ethereum?
Ethereum is in a downward correction. On the 4- hour chart, Ether fell to $2,033.70 and resumed upward. The long tails represented by the candlestick indicate that there is strong buying pressure above the $2033.70. Presently, the upward move is facing rejection at $3,000 high.
Note: cryptosignals.org is not a financial advisor. Do your research before investing your funds in any financial asset or presented product or event. We are not responsible for your investing results