Solana (SOL) Approaches a Key Resistance Level
Estimated Reading Time: 3 minutes
Don’t invest unless you’re prepared to lose all the money you invest. This is a high-risk investment and you are unlikely to be protected if something goes wrong. Take 2 minutes to learn more

Summary:
- SOL is building momentum as the Solana ecosystem continues to grow.
- Price is rebounding but remains below the 9-day EMA.
- A break above the EMA could pave the way toward the $100 and $150 targets.
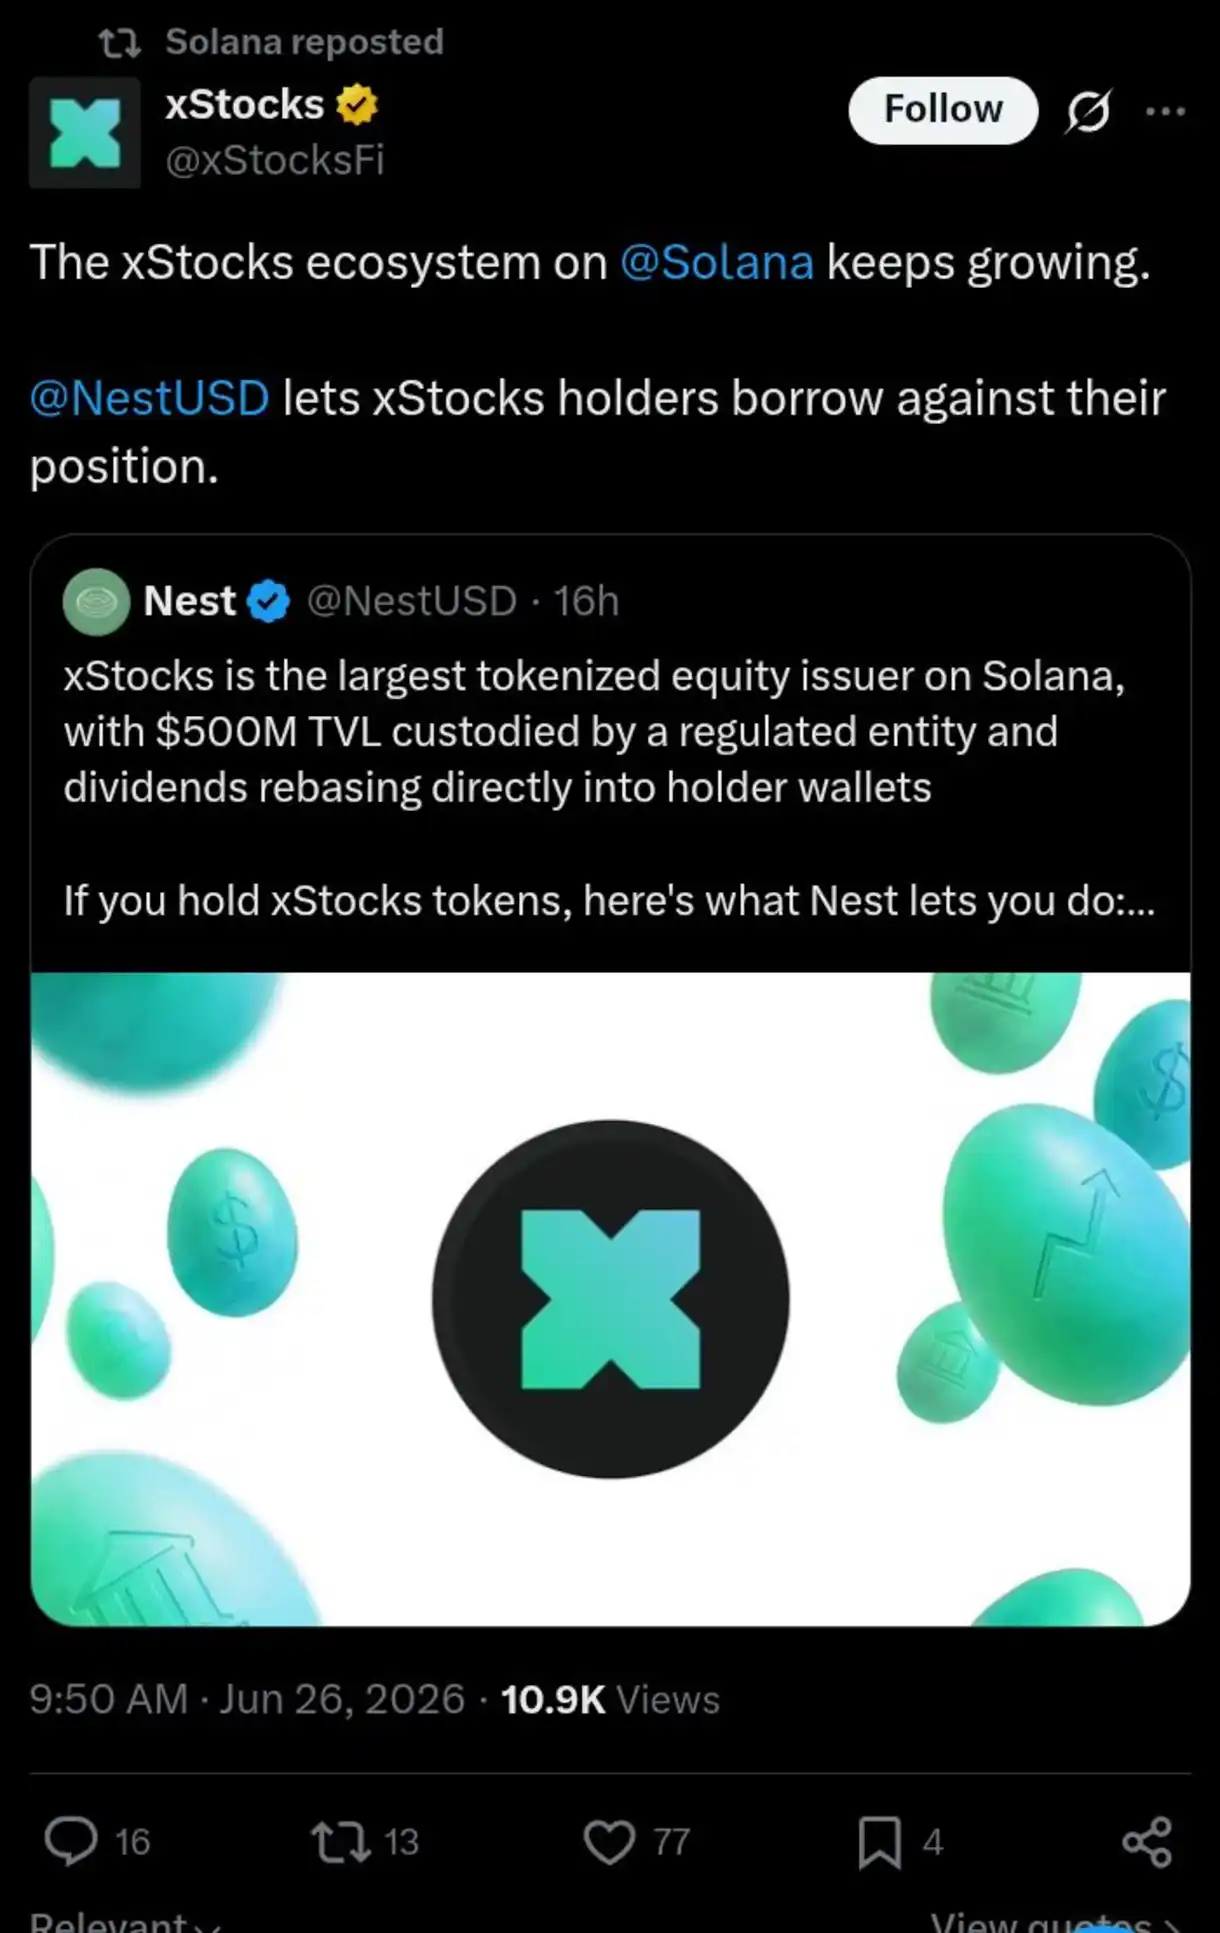
The Solana blockchain has continued to grow quietly, as reflected by the xStocks market reaching an impressive $550 million. This development has the potential to drive the price of SOL higher as more investors are attracted to the ecosystem. In addition, several technical indicators suggest that the token may be quietly building momentum for another upward move.
Taking a Look at the Solana Market on the 24-Hour Chart
The price chart shows that earlier this month, Solana briefly broke above the $70 level. However, the breakout was short-lived, as the market soon retreated below that level.
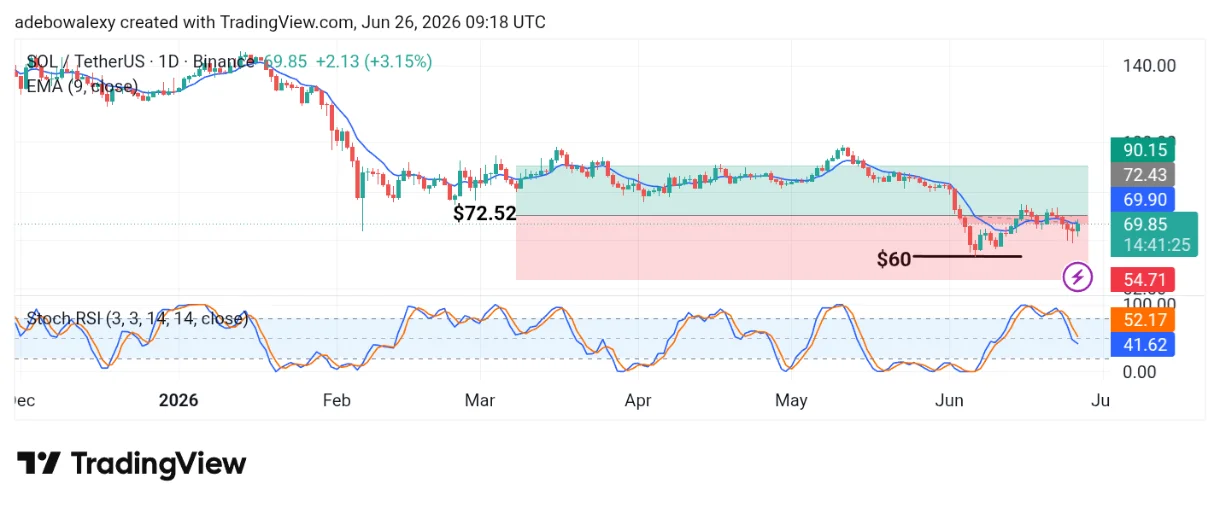
Although today’s trading session has produced a modest rebound, price action remains below the 9-day Exponential Moving Average (EMA). As of this writing, SOL is trading around the $69.85 level. Meanwhile, the Stochastic Relative Strength Index (SRSI) is beginning to turn higher, hinting at a potential bullish crossover.
Can Traders Capitalize on the Current Move?
Today’s trading activity stands out compared to the previous five sessions, during which bearish pressure consistently pushed the market lower. The current session has produced a rebound, bringing price action closer to the 9-day EMA.
Likewise, the SRSI lines have started to curve upward, suggesting improving momentum. However, this rebound may only provide short-term support, as the market has yet to break above the 9-day EMA, which remains an important technical hurdle.
Solana May Require More Patience
Although today’s bullish session is encouraging, traders may still need to exercise patience. Price action remains below a key technical resistance, making a decisive move above the 9-day EMA essential for confirming a stronger short-term recovery.
At the same time, the SRSI is attempting a bullish crossover after entering the oversold region, indicating that momentum may continue to improve. Consequently, traders may prefer to wait for a confirmed break above the 9-day EMA before targeting higher prices in the short term.
From a longer-term perspective, however, Solana’s growing ecosystem continues to support a bullish outlook. As a result, traders may keep the $100 and $150 price levels in view as long-term upside targets.