Bitcoin (BTC) Price Prediction: BTC/USDT Still Eyes a Breakout
Estimated Reading Time: 2 minutes
Don’t invest unless you’re prepared to lose all the money you invest. This is a high-risk investment and you are unlikely to be protected if something goes wrong. Take 2 minutes to learn more

Date: December 31, 2025
The Bitcoin market has remained confined below the $90,000 price level for some time. Although price action has attempted to breach this resistance, those attempts have so far failed. Let’s take a closer look at the market to identify potential short-term opportunities.
BTC/USDT Long-Term Trend — Bearish (Daily Chart)
Key Price Levels
Resistance: $90,000, $92,500, $95,000
Support: $88,000, $86,000, $85,000
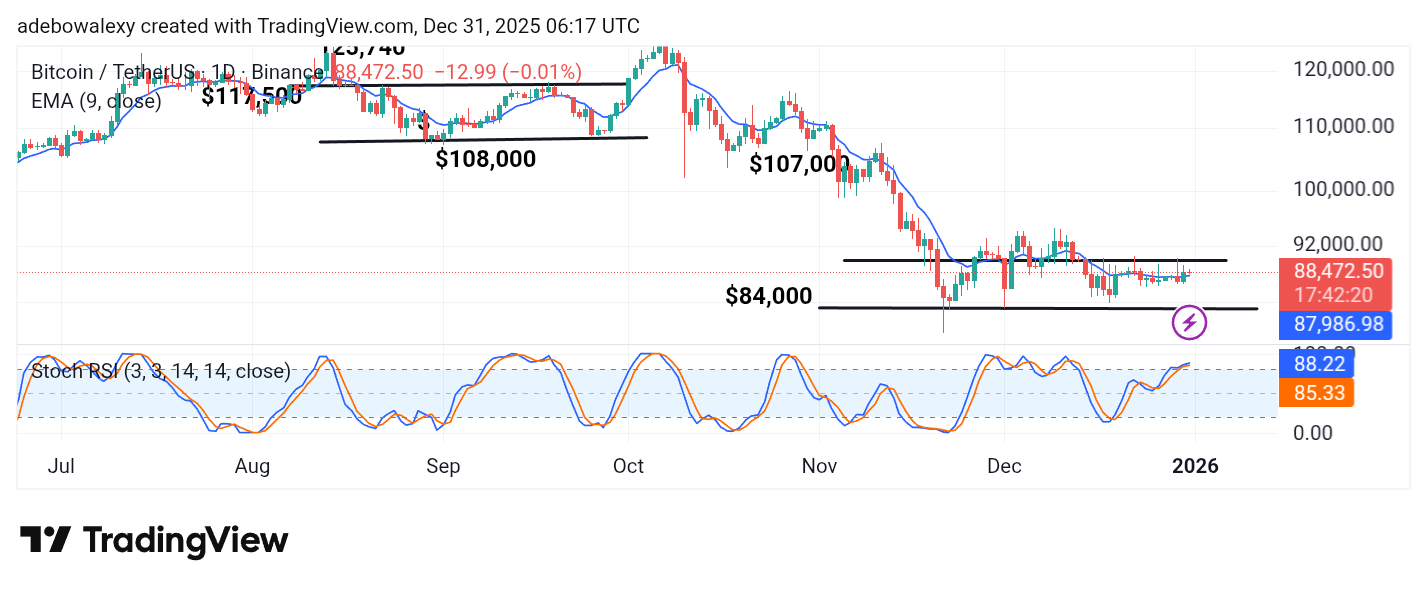
Although the Bitcoin market continues to trade below the $90,000 level, price action shows some short-term movement. The latest price candle on the daily chart is a red doji, and it stands above the 9-day Exponential Moving Average (EMA). At the same time, the Stochastic Relative Strength Index (SRSI) lines have risen into the region above the 80 threshold. The terminal part of the SRSI continues to edge slightly toward the 100 level of the indicator.
Bitcoin Price Prediction: BTC/USDT Market Eyes the $90K Mark
The Bitcoin market has been trending largely sideways in recent sessions. However, the $90,000 price level appears to be a more logical target at this point. In line with this, the SRSI lines can still be seen moving slightly higher above the 80 level.
The most recent price candle also stands just above the 9-day EMA curve, although it appears to be under notable pressure. Nonetheless, upside momentum still has a chance to prevail.
Bitcoin Price Prediction: BTC/USDT Shows Positive Consistency (4-Hour Chart)
On the Bitcoin 4-hour chart, price action has remained above the 9-day Exponential Moving Average (EMA). Unlike the red candle on the daily chart, the most recent candle here is green.
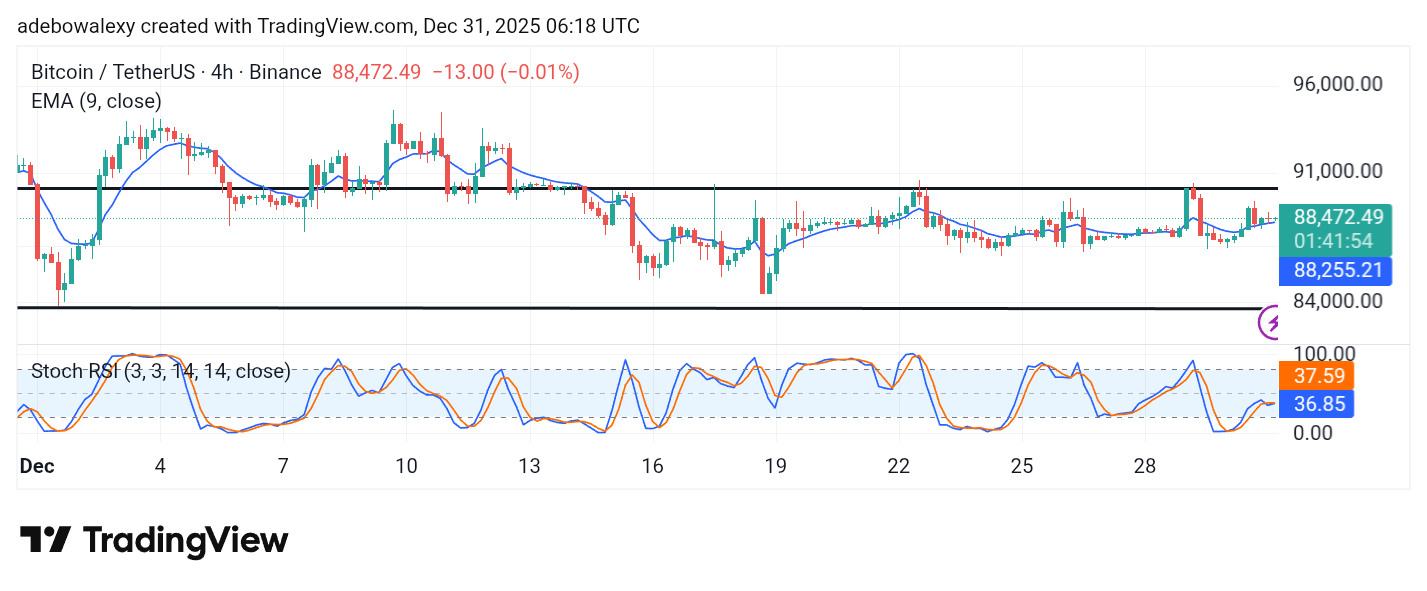
Although it shares a similar structure with the previous red candle, its position above the 9-day EMA suggests a degree of bullish sentiment. Meanwhile, the SRSI lines are below the 50 threshold but are still angled slightly upward toward it. Consequently, the market appears poised to make a push toward the $90,000 price level, as previously noted.