Binance Coin (BNB) Faces Rejection At $550, May Resume Downward
Estimated Reading Time: 2 minutes
Don’t invest unless you’re prepared to lose all the money you invest. This is a high-risk investment and you are unlikely to be protected if something goes wrong. Take 2 minutes to learn more

Binance Coin (BNB) Long-Term Analysis: Bullish
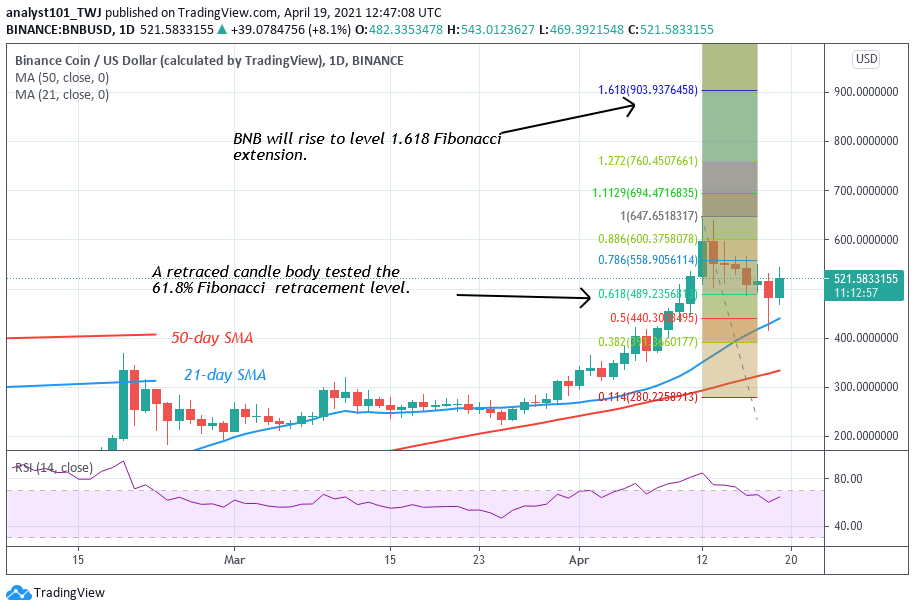
Binance Coin price is in an uptrend but it is facing rejection at the recent high. The crypto retraced from the high of $650 to $416 low. BNB price corrected upward but faces resistance at $550. On April 12 uptrend, a retraced candle body tested the 61.8 Fibonacci retracement level. The retracement indicates that the market will rise to level 1.618 Fibonacci extension or the high of $903.93. Meanwhile, buyers are struggling to break the $550 resistance.
Binance Coin (BNB) Indicator Analysis
The altcoin has fallen to level 60 of the Relative Strength Index period 14. BNB is in the uptrend zone and above the centerline 50. The 21-day SMA and 50-day SMA are sloping upward indicating the previous trend.
Technical indicators:
Major Resistance Levels – $640, $660, $680
Major Support Levels – $540, $520, $500
What Is the Next Direction for Binance Coin (BNB)?
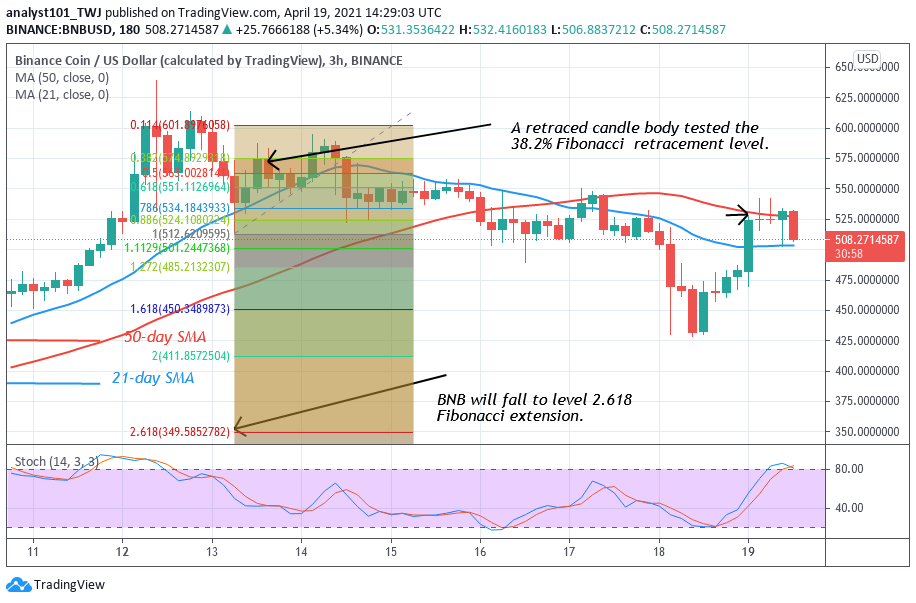
On the 4 Hour chart, Binance Coin is facing rejection at the $550 resistance zone. The selling pressure will resume if the bulls fail to break the $550 resistance. On April 13 downtrend, a retraced candle body tested the 38.2% Fibonacci retracement level. This retracement implies that BNB will fall to level 2.618 Fibonacci extensions or the low of $349.58.
Note: cryptosignals.org is not a financial advisor. Do your research before investing your funds in any financial asset or presented product or event. We are not responsible for your investing results