Cardano (ADA/USDT) Eyes Potential Recovery Amidst Market Conditions
Estimated Reading Time: 3 minutes
Don’t invest unless you’re prepared to lose all the money you invest. This is a high-risk investment and you are unlikely to be protected if something goes wrong. Take 2 minutes to learn more

ADA/USDT Long-term Analysis: Ranging
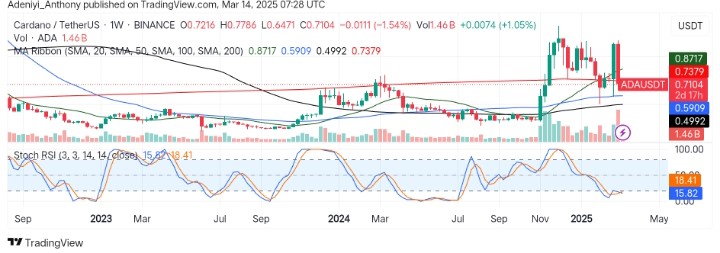
The market for Cardano against the Tether over time has been ranging below the $1.000 level since the beginning of 2025. The pair’s price has been falling and rising within a tight region.
Recent trade activity shows that Cardano has experienced a significant dip after what seemingly looks like a recovery to the North. However, the appearance of the 200-period moving averages suggests the bearish dominance.
To this end, confirmation of a bullish recovery is needed as the Stochastic RSI lines still oscillate in the oversold region.
Currently, Cardano trades at $0.7104, with a 1.46 billion weekly traded volume.
Technical Indicators
Major Resistance Levels: $0.7379, $0.8717, $1.0000
Major Support Levels: $0.5909, $0.4992, $0.4000
Cardano Technical Analysis
The weekly analysis of Cardano against the Tether seems to oscillate between $0.6000 and $1.0000. Though a cloud of bearishness surrounds the market, the 20-SMA’s placement above the 200-SMA signals weak short-term bullish momentum on the horizon.
On the other hand, the Stochastic RSI suggests the market lacks direction, as both lines operate in the oversold region.
To this end, the pair’s price needs to break above $0.7711 for a confirmed upside movement; otherwise, if selling pressure persists, a pullback toward the 50-SMA level at $0.5909 is possible.
ADA/USDT Analysis: What to Expect
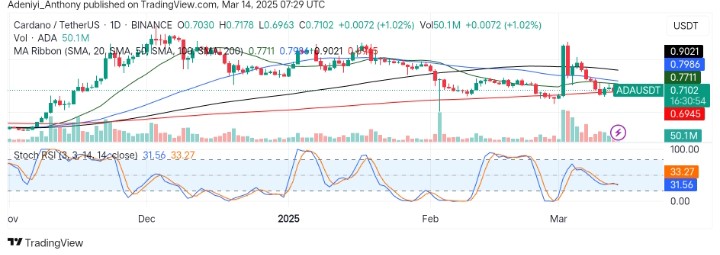
On the daily timeframe, ADA/USDT has moved significantly to the south after hitting a level close to $0.9021 in previous trades. However, recent price actions suggest an impending breakout as the price targets the short-period moving average.
Also, the Stochastic RSI beneath the chart shows that the pair has been moving rightward without a clear direction.
To this end, ADA/USDT may recover towards $1.000 if bullish traders can use the volume to their favor, as a break below the current level would indicate the continuation of the consolidation phase.
You can purchase crypto coins here. Buy LBlock