Fantom (FTM/USD) Struggles with Lower Highs, Yet Support Holds Strong
Estimated Reading Time: 3 minutes
Don’t invest unless you’re prepared to lose all the money you invest. This is a high-risk investment and you are unlikely to be protected if something goes wrong. Take 2 minutes to learn more
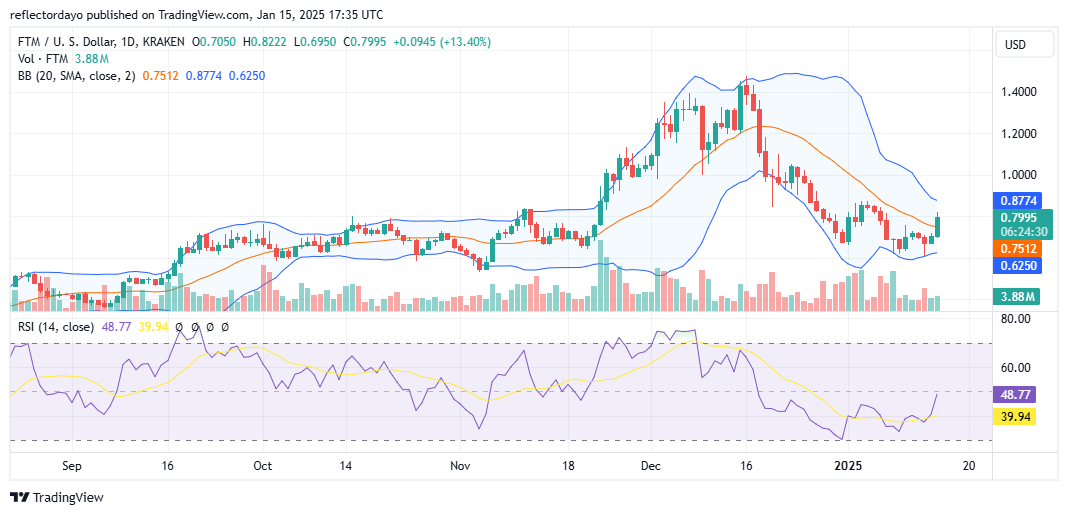
The bear market in the Fantom (FTM) market began in mid-December, near the $1.40 price level, following an impressive bullish rally that started in November and peaked around $0.70. As the new year unfolded, the market found support near the $0.65 level. Bulls displayed renewed enthusiasm, swiftly reversing the trend to the upside. However, the rally stalled, forming a lower peak around $0.87.
In today’s trading session, bullish momentum once again pushed prices higher. However, the price faced resistance and formed yet another lower peak compared to the previous one, with rejection occurring near the $0.80 level. This pattern in the crypto signal underscores persistent selling pressure at lower price levels, signaling challenges for sustained bullish advancement.
Fantom Market Data
- FTM/USD Price Now: $0.799
- FTM/USD Market Cap: $ 2.8 billion
- FTM/USD Circulating Supply:2.8 billion FTM
- FTM/USD Total Supply: 3.2 billion FTM
- FTM/USD CoinMarketCap Ranking: #
Key Levels
- Resistance: $0.85, $0.90, and $0.95
- Support: $0.65, $0.60, and $0.55.
The Fantom Market Through the Lens of Indicators
Although bullish activity since January 1 at the $0.65 support level has remained strong, the formation of descending peaks continues to exert significant pressure on the bulls’ position. Currently, the candlesticks indicate robust bullish momentum, but the price faces notable resistance at the $0.80 level.
If the bullish price action manages to break above the $0.80 resistance, it could pave the way to challenge the next key level at $0.85, where another round of resistance is likely. A successful breakout above $0.85 could drive the market higher, potentially testing the critical $1.00 resistance level.
For now, Fantom traders are closely monitoring price action around the $0.80 level to gauge the market’s next move.
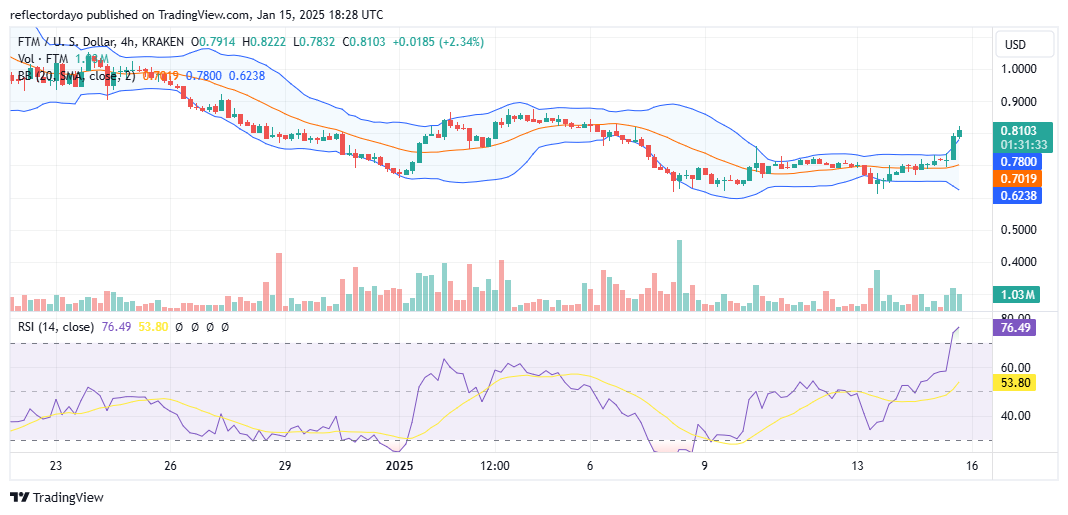
FTM/USD Price Prediction: 4-Hour Chart Analysis
A closer analysis of the 4-hour price chart reveals active bearish pressure around the $0.80 level, countered by notable bullish resilience. The chart reflects bullish efforts to push through the bearish resistance, as evidenced by the visible price movement. However, the small upper shadow on the candlestick highlights the presence of pessimistic traders engaging in selling activity at this level.
Despite this, bullish sentiment remains robust enough to sustain the price slightly above the $0.80 mark. Should the bulls maintain their momentum above this level, the market could likely enter a consolidation phase or potentially shift toward an upward price movement.