Uniswap (UNI/USD) Maintains Its Rises and Falls Within Well-Defined Bullish Channel Trend-Lines
Estimated Reading Time: 3 minutes
Don’t invest unless you’re prepared to lose all the money you invest. This is a high-risk investment and you are unlikely to be protected if something goes wrong. Take 2 minutes to learn more
Uniswap Price Prediction – April 22
There has been a line of significant risings and fallings in the market worth of UNI/USD over a couple of trading days’ sessions now within well-definite bullish channel trendlines.
UNI/USD Market
Key Levels:
Resistance levels: $40, $45, $50
Support levels: $25, $20, $15
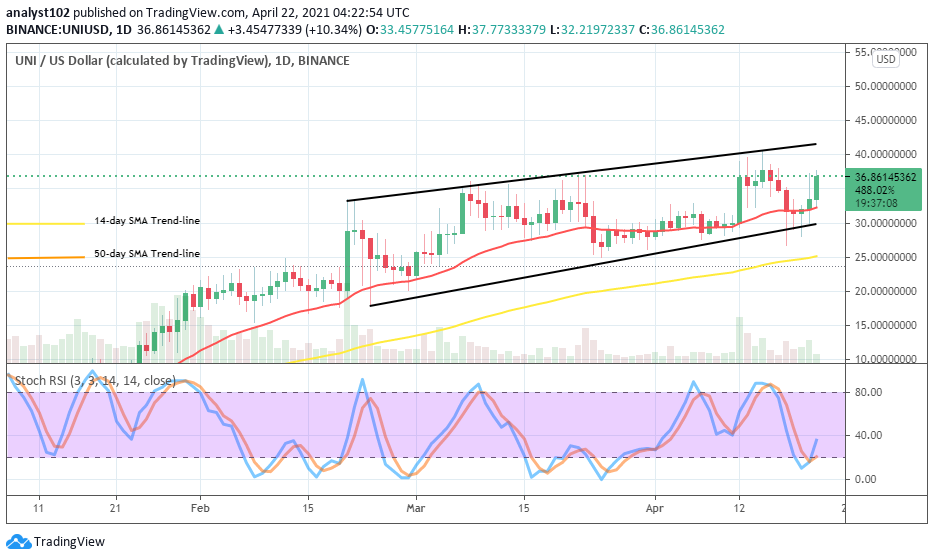
UNI/USD – Daily Chart
A fresh bullish candlestick has emerged from the buy signal side of the smaller SMA trading indicator within the bullish channel trendlines drawn. The upper bullish trend-line is located a bit over the immediate resistance level of $40. The 14-day SMA trading indicator is closely located over the lower bullish channel trend-line around $30. And, the 50-day SMA trend-line is situated underneath them at a $25 support line. The Stochastic Oscillators have crossed the hairs to point to the north near range 40. That signals the possibility of getting to see up-moves in a near time.
Will the UNI/USD values linger on more within the well-defined channels?
The present kind of bullish trading channels that the UNI/USD market operations keep has a strong tendency to maintain it until a while in the next sessions. Therefore, bulls may have to find their buy support entries during the period that price reverses towards the lower bullish trend-line. Any attempt differed from that may cause panic buy that can as well result in bull caging.
Analyzing the probable downfall of this crypto-economy, it would equally technical speak well that the UNI/USD bears may be on the lookout for touches around or the upper bullish channel trend-line before considering any possible sell order. However, much carefulness needs to be drawn a violent breakout at that zone so as not to eventually get trapped.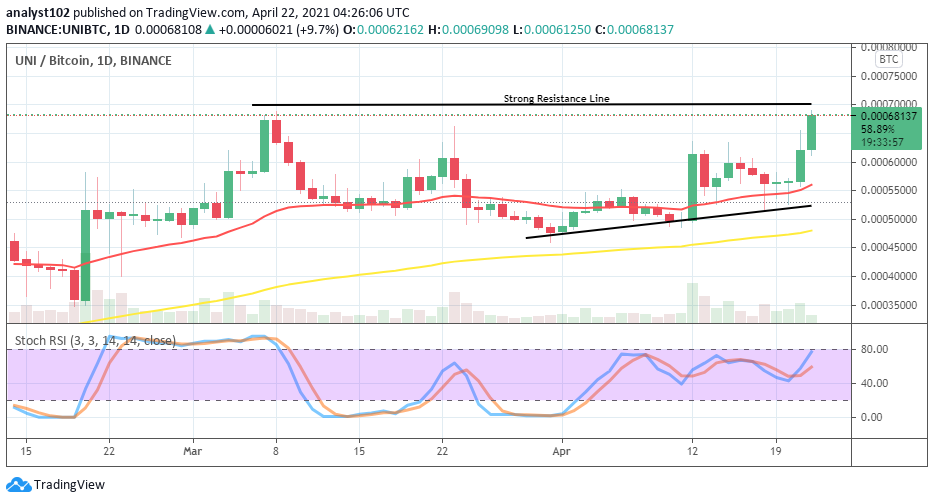
UNI/BTC Price Analysis
On the scale of comparison, the market worth between UNI and BTC, trading chart shows that the base crypto is again on the verge of pushing ahead the counter crypto. But, Uniswap seems to be facing strong resistance in the near session. The 14-day SMA trend-line is above the 50-day SMA indicator. And, they are all underneath the current purchasing power of UNI over BTC. The Stochastic Oscillators have crossed the hairs to point to the north between ranges of 40 and 80. That gives a sign that the base crypto is still some extent playing a domineering role in the market as paired with the counter instrument.
Note: cryptosignals.org is not a financial advisor. Do your research before investing your funds in any financial asset or presented product or event. We are not responsible for your investing results.