Polkadot Attempts a Reversal as It Hovers above $4.96
Estimated Reading Time: 3 minutes
Don’t invest unless you’re prepared to lose all the money you invest. This is a high-risk investment and you are unlikely to be protected if something goes wrong. Take 2 minutes to learn more
Polkadot (DOT) Long-Term Analysis: Bearish
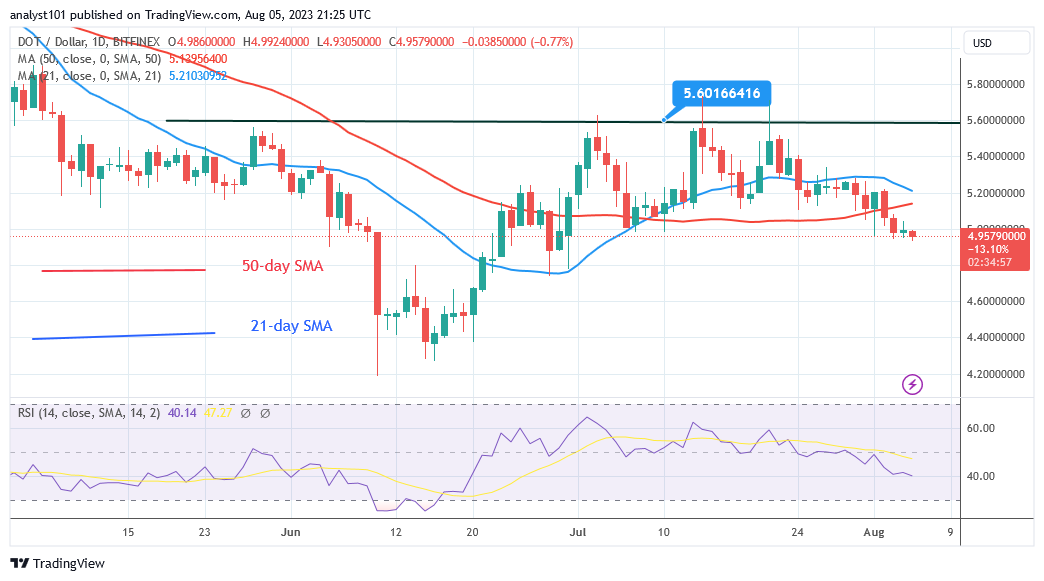
Polkadot (DOT) price has dropped after breaking below the moving average lines as it hovers above $4.96. Polkadot was trading in the positive trend zone before failing to breach the barrier at $5.60 to resume an uptrend. Buyers made three futile attempts to overcome the obstacle before being repulsed.
At the time of writing, the altcoin had plummeted to a low of $4.96. The market is regarded as having entered the oversold zone with the most recent decline from the high of $5.60 as it reaches the low of $4.96. Since August 1, the current support level of $4.96 has been retested.
The price of the cryptocurrency has been ranging between $4.96 and $5.20. The value of the altcoin will decrease even further to $4.40 if the current support is breached.
Technical indicators:
Major Resistance Levels – $10, $12, $14
Major Support Levels – $8, $6, $4
Polkadot (DOT) Indicator Analysis
The cryptocurrency has dropped below the Relative Strength Index level of 40 for period 14. The DOT price is predicted to fall since it has entered the bearish trend zone. The cryptocurrency declines as the price bars drop below the moving average lines. The market’s downward momentum has reached an oversold level.
The daily Stochastic indicator is below the 20-point barrier, indicating a bearish weariness.
What Is the Next Direction for Polkadot (DOT)
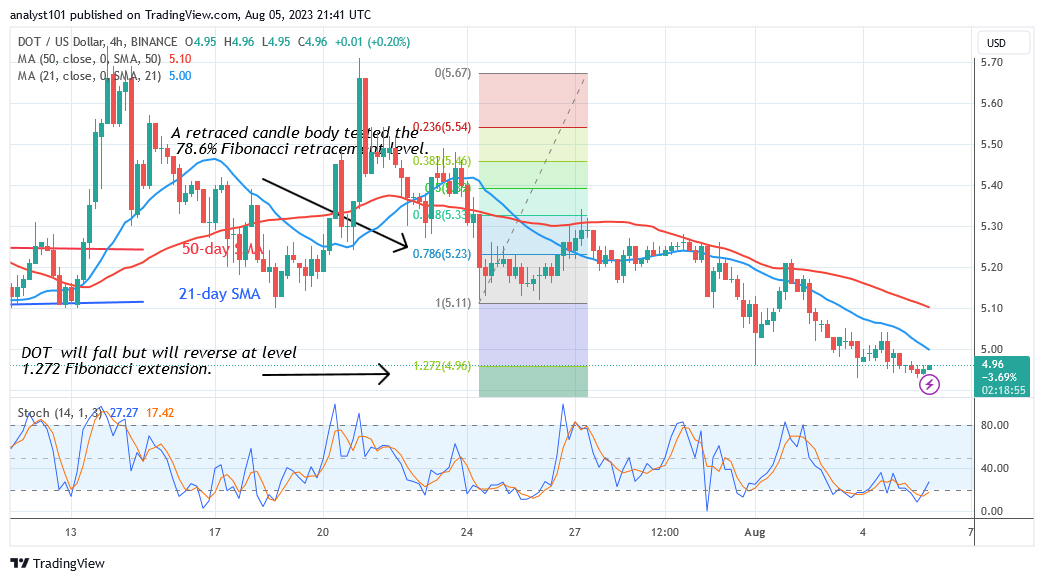
Polkadot has dropped dramatically in the bearish trend zone as it hovers above $4.96. The altcoin hit a low of $5.12 on the 4-hour chart on July 24. DOT price rose and the candle body tested the 78.6% Fibonacci retracement line. This correction just suggests that Polkadot will fall to its previous low at the 1.272 Fibonacci extension, or $4.96.
The market is expected to revert at the current support.
You can purchase Lucky Block here. Buy LBLOCK
Note: Cryptosignals.org is not a financial advisor. Do your research before investing your funds in any financial asset or presented product or event. We are not responsible for your investing results